Filter Action examples
The Filter Action can quickly filter your data using multiple columns and methods. The examples below demonstrate the flexibility of this transformation step to help you visualize the data you need to see to make informed decisions.
Comparing columns
If you only want to return rows where one column has a certain relationship (e.g., greater than, less than, etc.) to another column, you can use the Filter Action to compare these columns.
In the example below, we want to return only rows where our monthly number of Canceled documents is higher than our monthly number of Uploaded documents. Here’s the chart we’re working with:
Add a Filter Action to the Pipeline and use the following settings:

If you’d like to set multiple rules, you can do add more by clicking +Add Condition. When you’re done adding filter rules, click Save.
Your chart results are now automatically filtered depending on the selected columns’ results.
Filtering specific days of the week
Say you want to filter out weekends, or your business days comprise of a Monday-Saturday week or a Monday-Thursday week. How do we filter these other days of the week out?
This can be done in our Pipeline. Our Pipeline uses SQLite so we can employ functions available in SQLite.
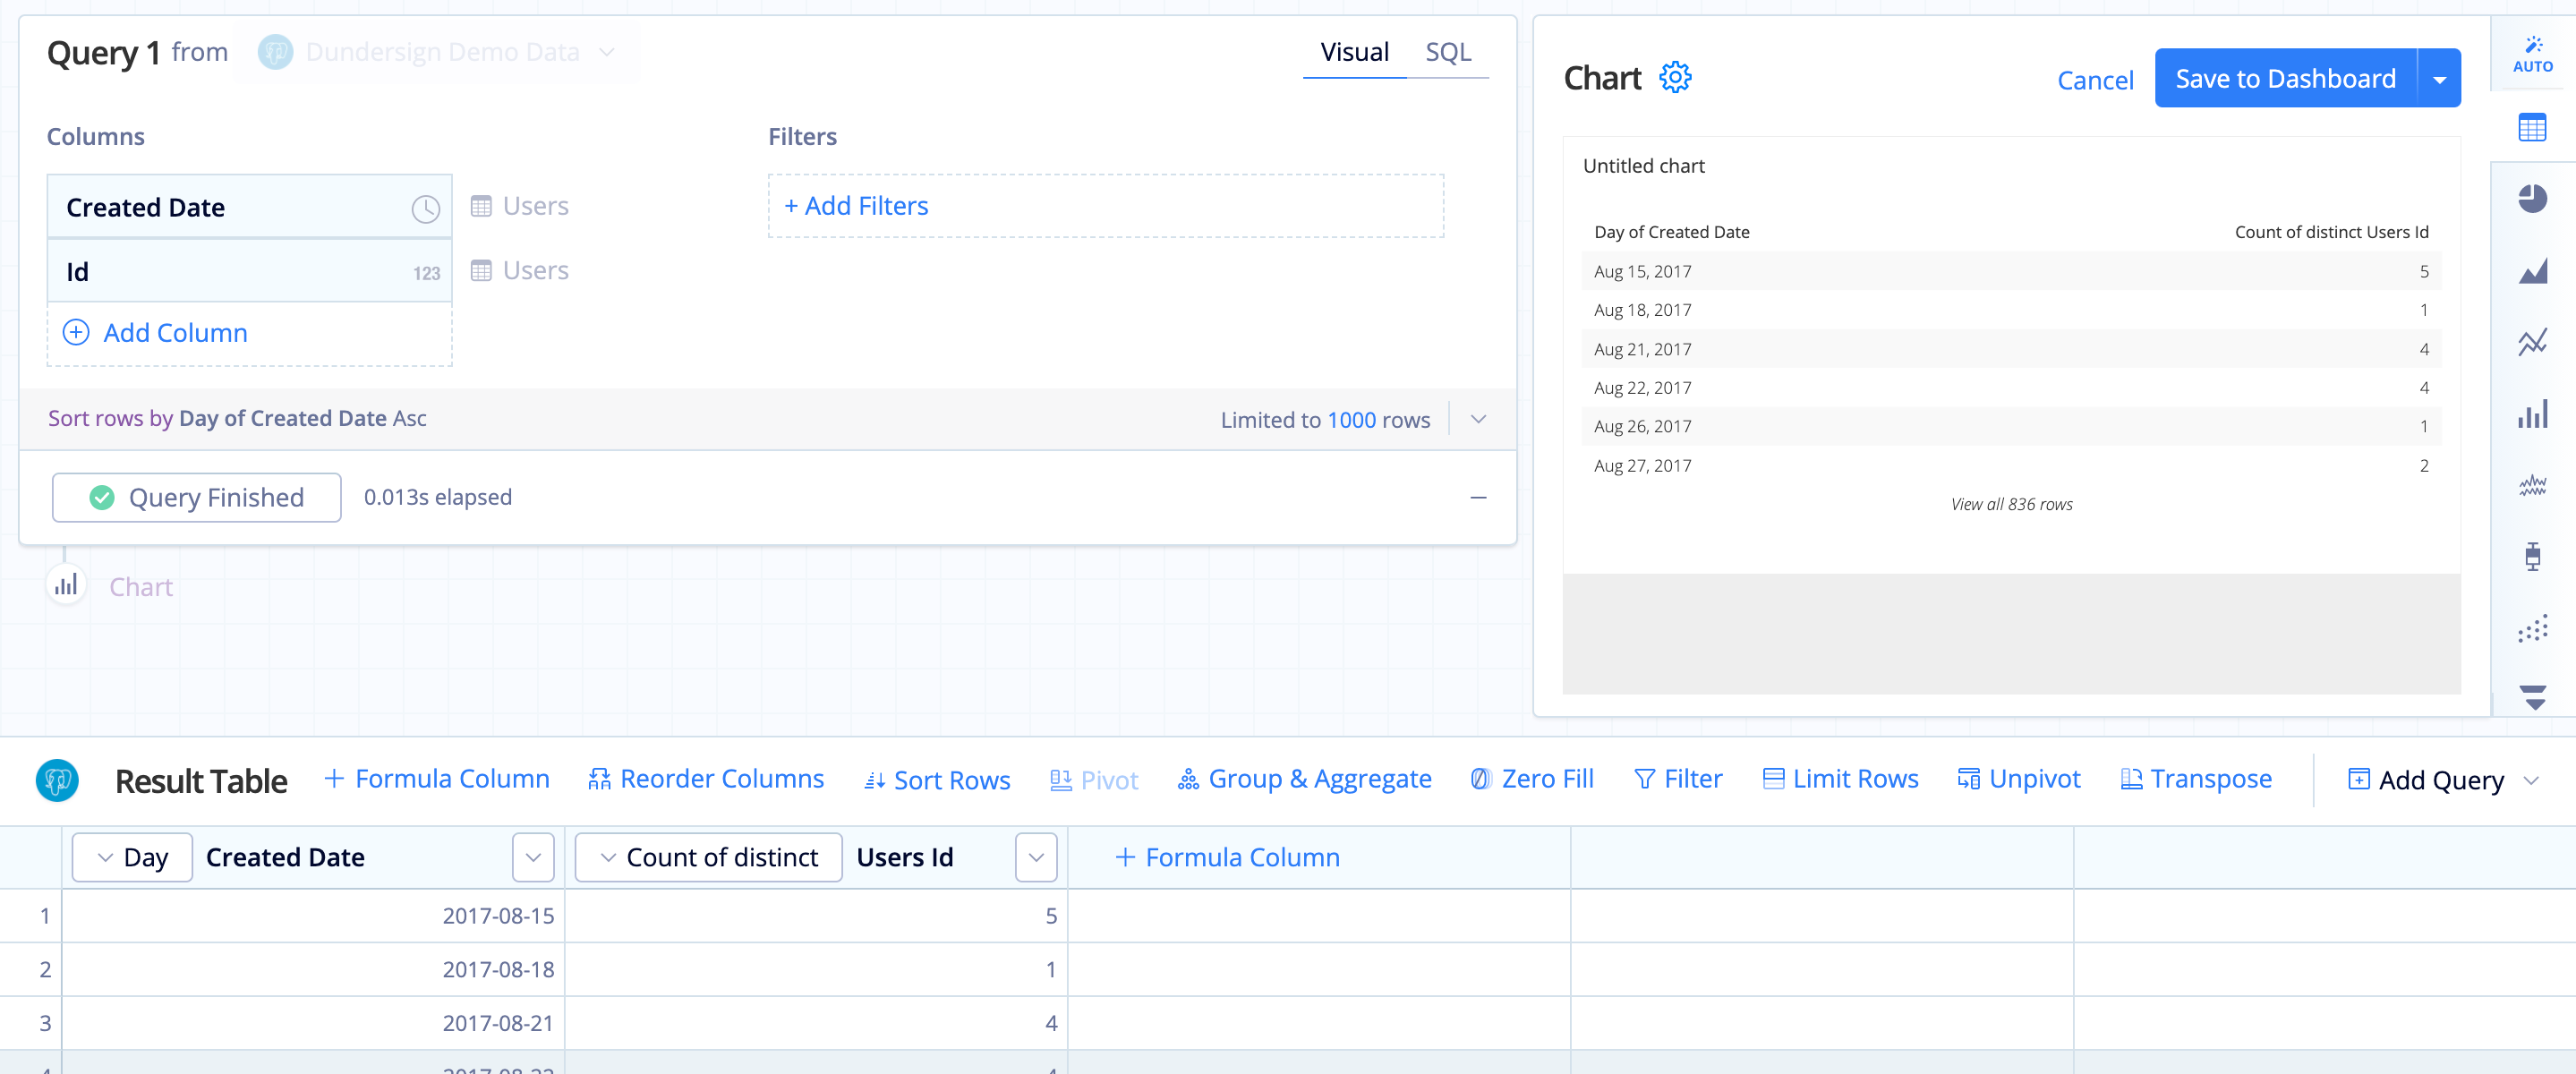
Our first step is our Query. We’ll need to add our date column to the Query of our chart and select “Day” as the time bucket for the date column. Let’s use this Query as an example:

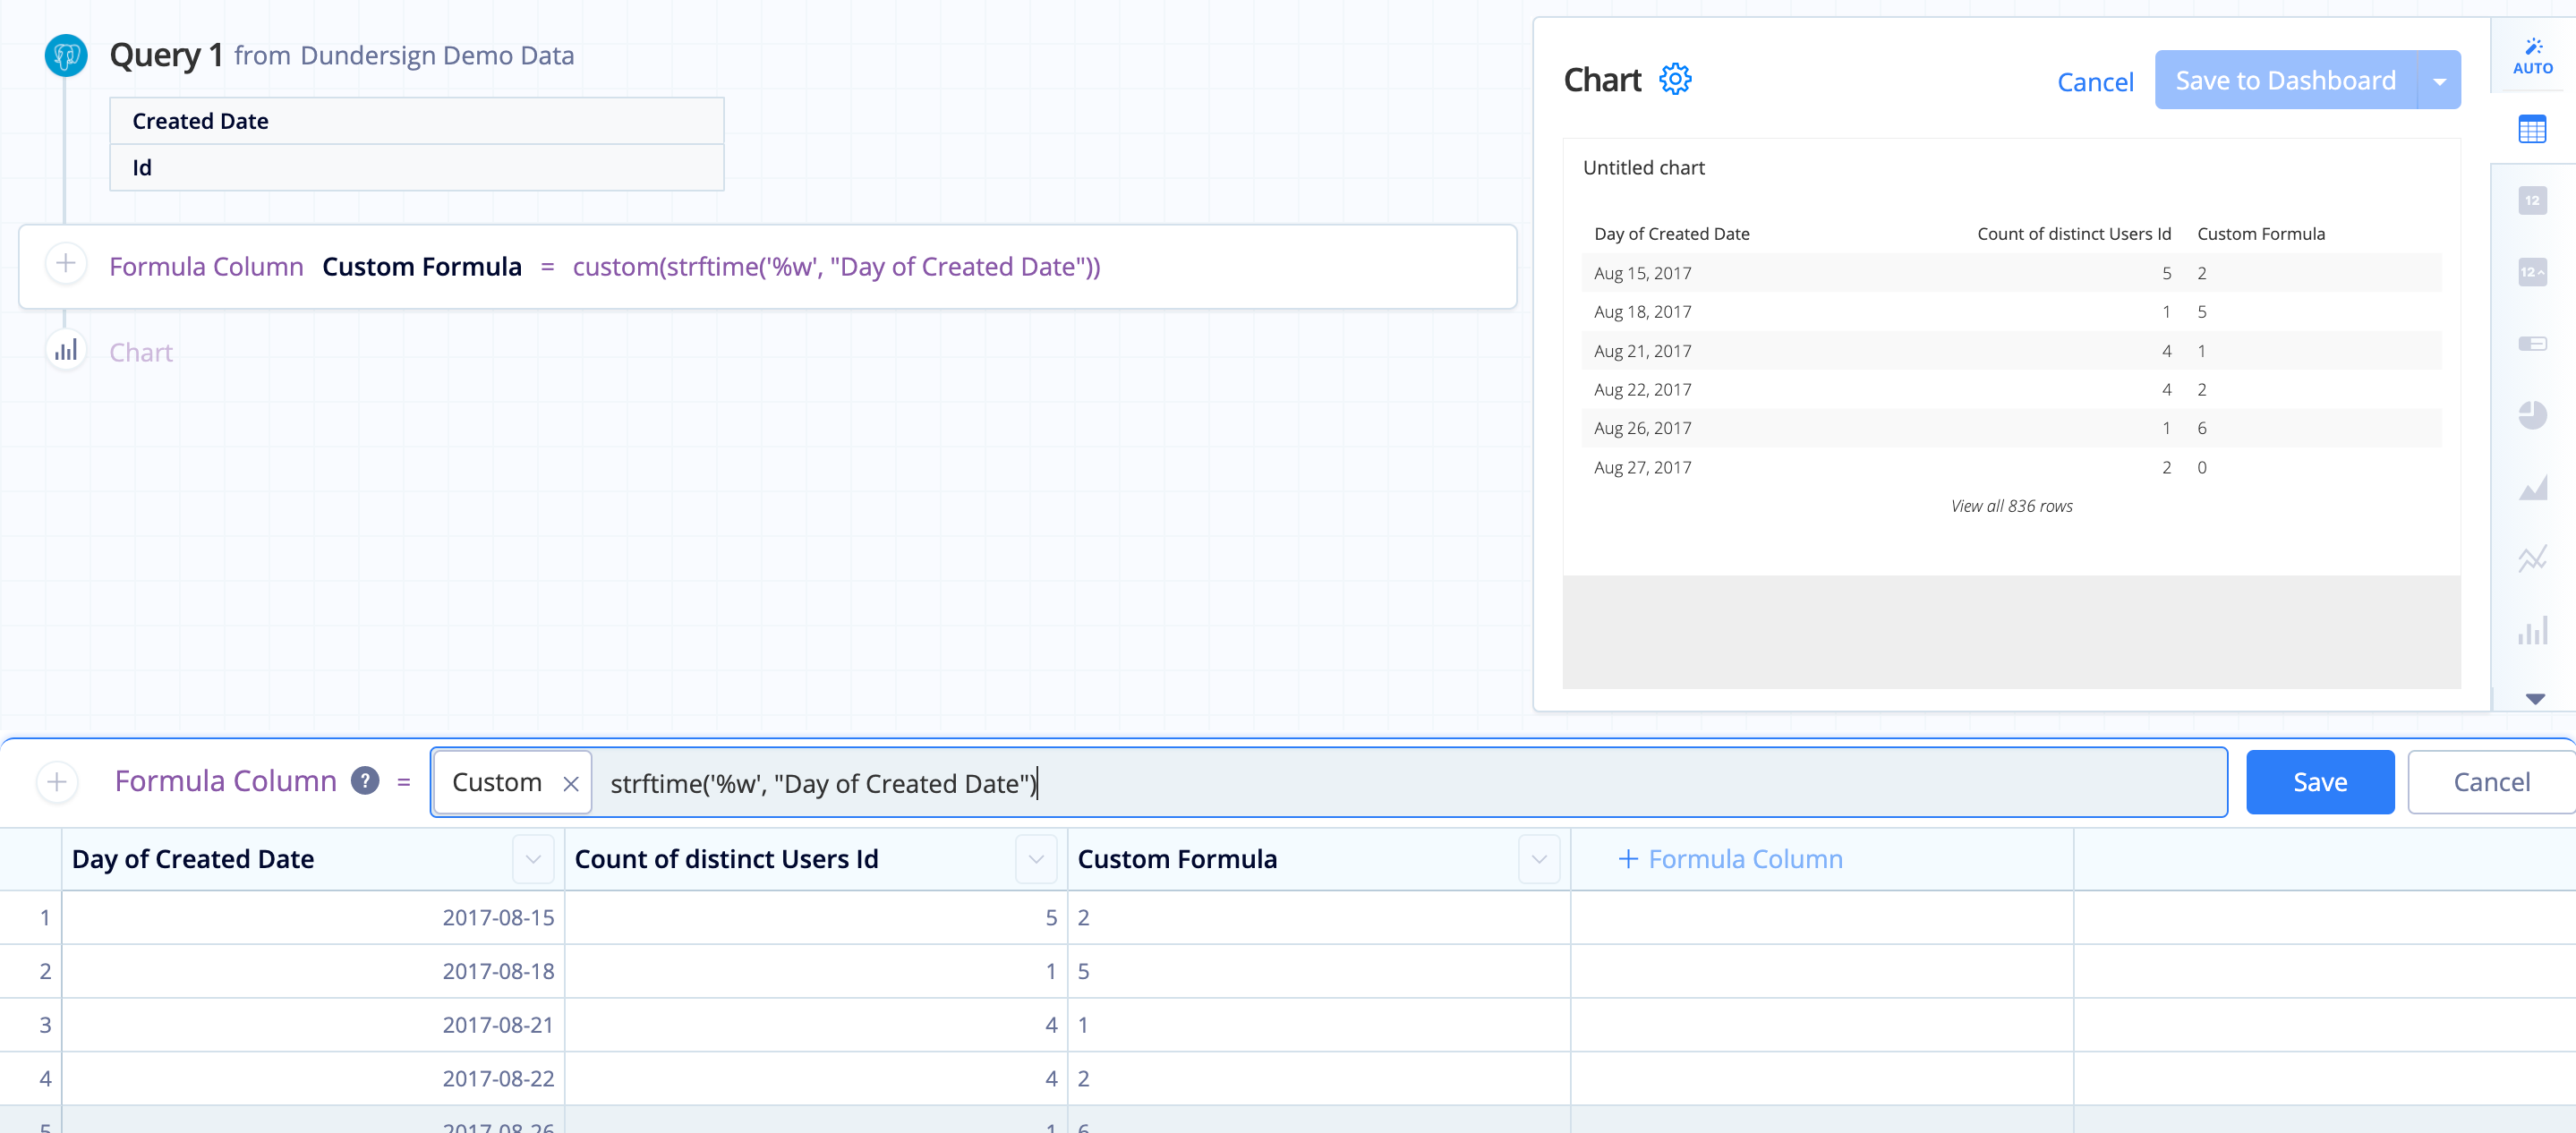
Our next step is to add a Formula Column Action in the Pipeline. We’ll use a Custom formula as the formula type and use the following formula:
strftime('%w', "Day of Created Date")

Once we apply this Pipeline step, we’ll have our days of the week listed out with Sunday = 0, Monday = 1, Tuesday = 2, …, Saturday = 6.
We’ll rename the new column to “DOW” (i.e., Day of Week) for clarity.
Now we can filter out values 0 and 6 using a Filter Action to remove any rows where the Created Date is a weekend. We’ll exclude rows matching all conditions where DOW is one of 0 and 6 as done below:
And that’s it! We’ve now excluded all the Saturday and Sunday data. You can now hide the DOW column using a Hide Column Action if it’s no longer needed.
Filter Variable results
Our Filter Action can also allow custom inputs. This includes Relative Date Variables and Dashboard Controls, which allows you to use data outside of your chart results to filter your chart output.
Variables can be used as is in the input field or can be combined to further customize your filters.
For example, if you want to only include results in your chart for dates later than your Calendar Control’s start date (here, named CALENDAR), you can simply type the Variable or Control name in the condition. Since we’re using a Calendar Control with a date range, we need to use the Chartio-specific syntax to use the Control’s start date: {CALENDAR.START}
If your Control is set to only one date, you won’t need to append anything to the Control’s name and can input it as is.
Below is another example of the Filter Action—this time using our Relative Date Variable {TODAY} to only include results from dates before today’s date. This date automatically changes according to the current day and filters the chart without needing manual changes.


