Group & Aggregate example
A common metric that lots of companies are interested in knowing is the monthly average of the count of users created per day. You can calculate this using a nested SELECT statement in SQL Mode or do it in Visual Mode in just a few steps.
For this example, we use our Dundersign Demo Data data source.
-
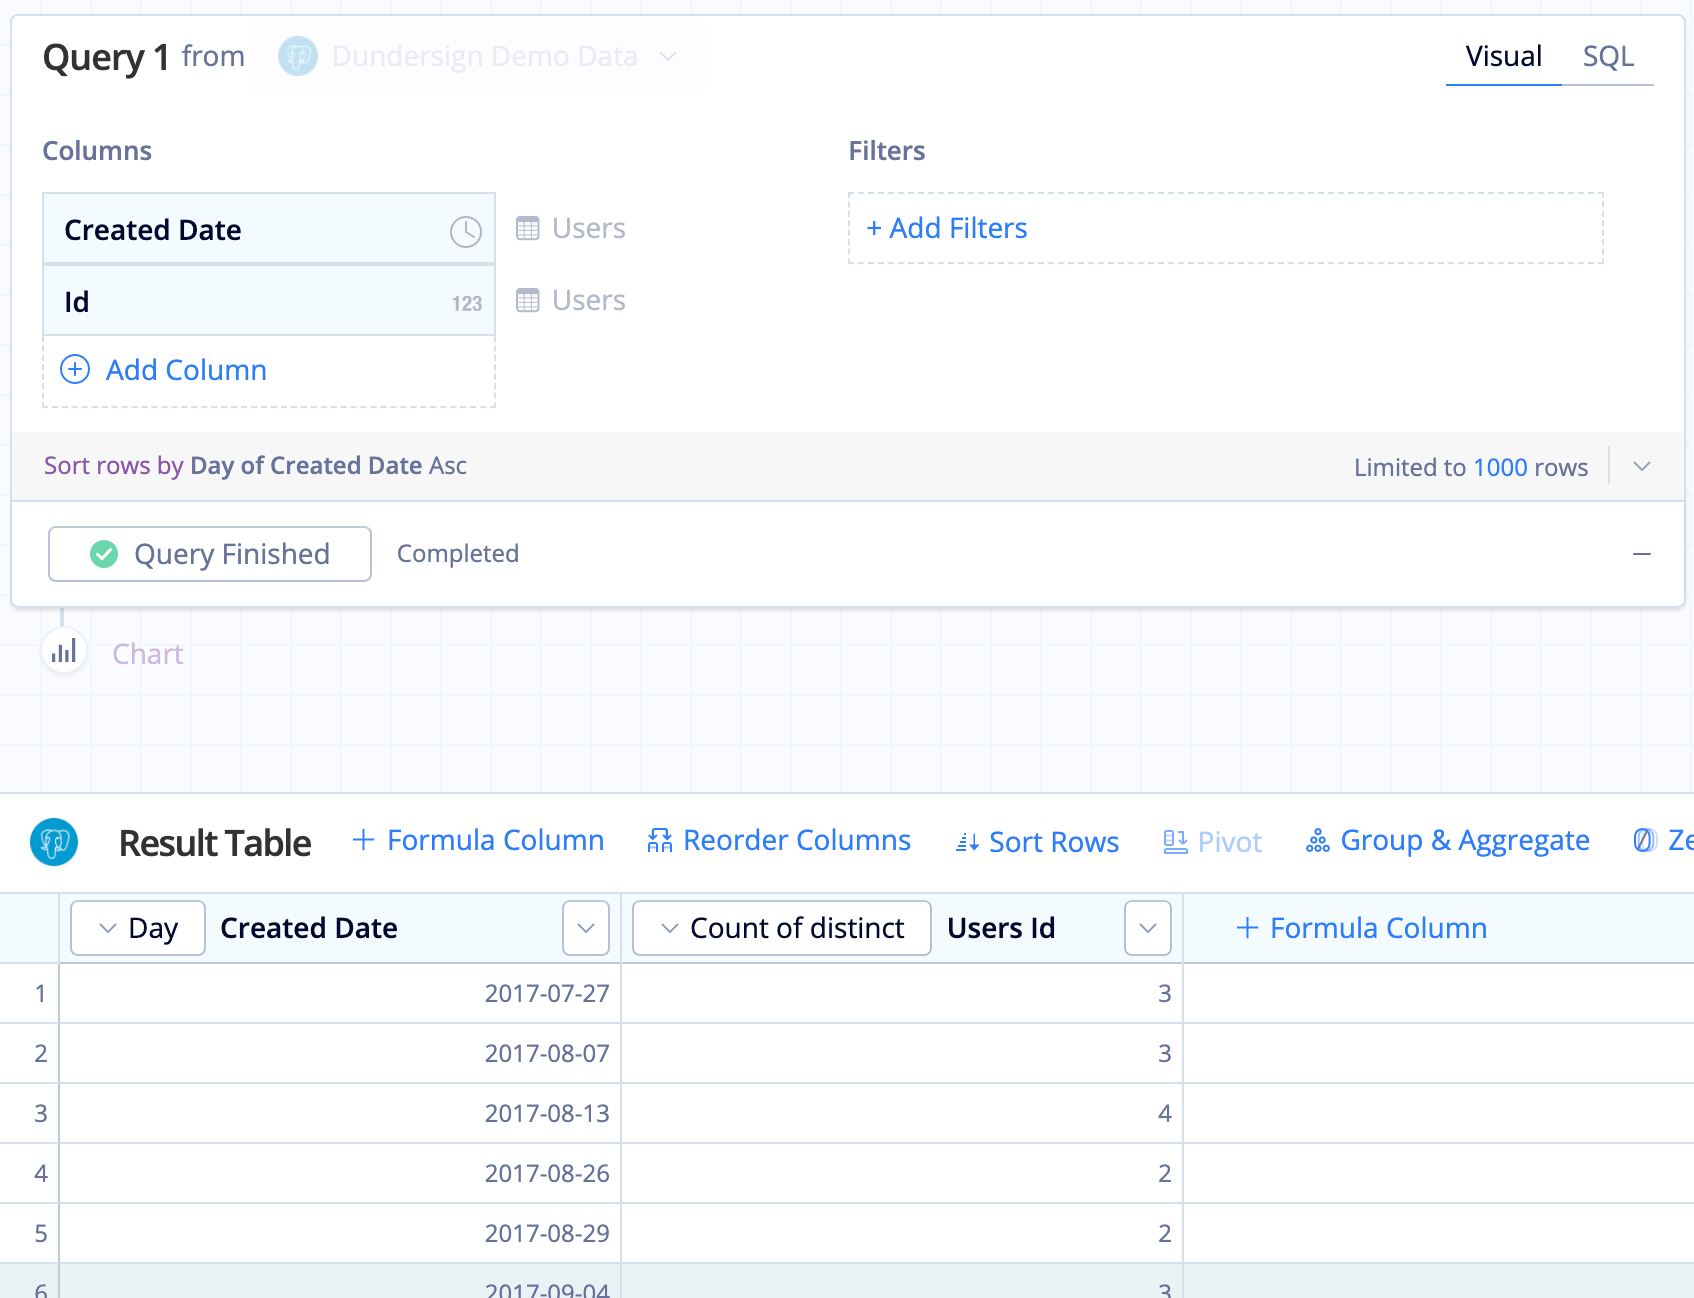
First, add the Id and Created Date columns from the Users table. In the Results Table, make sure Created Date is grouped by Day and Id is aggregated using Count of Distinct.
Your result set might look something like the image below:
Note: If you don’t need to use the full date column in your chart before calculating the average, you can instead group your Created Date column by the Month time bucket here and skip to step 6.

-
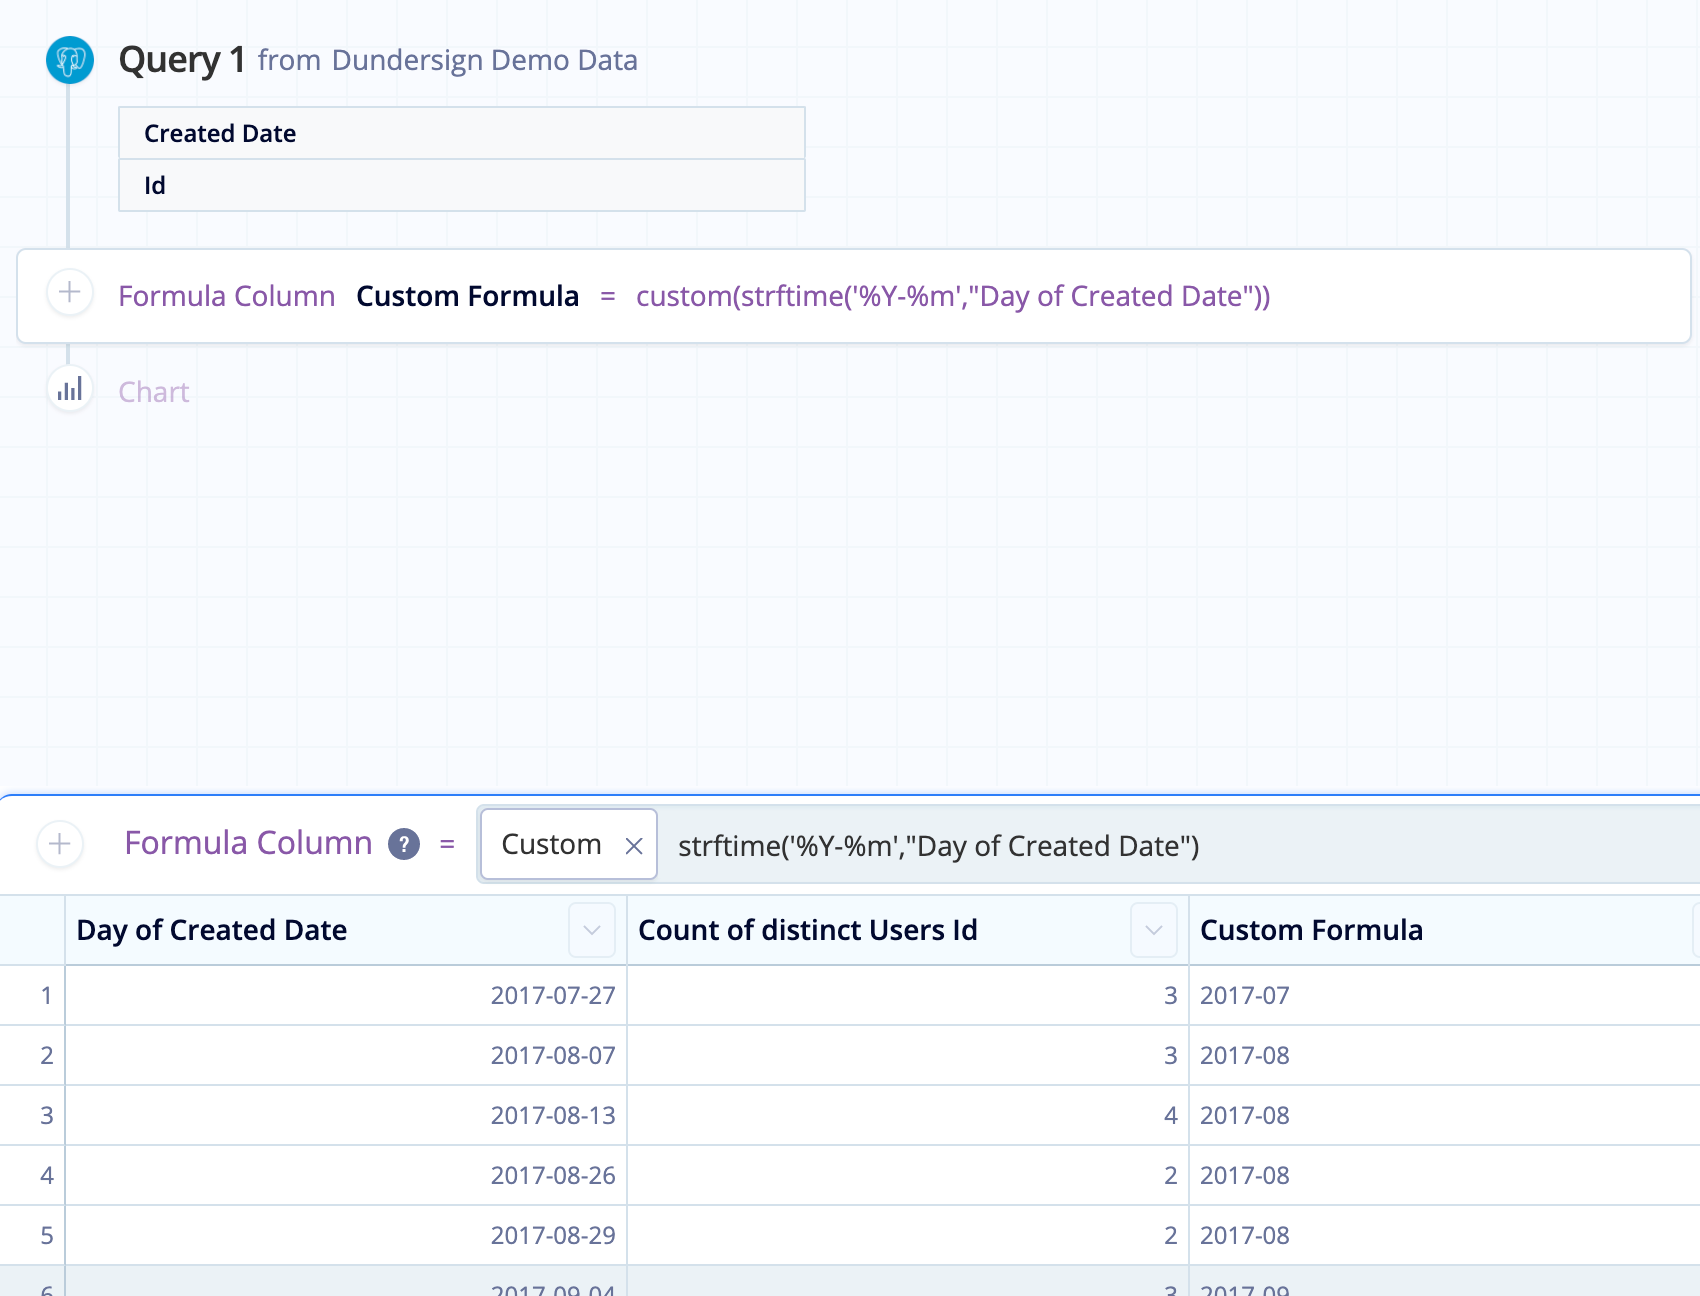
Next, we want to create a column showing only the month and year of Created Date so we can use it to group by later.
To do this, add a Formula Column, choose the Custom formula type, then use the SQLite strftime() function function below for the formula, which extracts only the month and year from the “Created Date” column. We’ll use this column to group the average number of new users per month.
strftime('%Y-%m',"Day of Created Date")For clarity, rename this new column to Month of Created Date.

- Now use Hide Column to hide the “Created Date” column since it’s no longer needed.
-
Then, use a Reorder Columns Action to move the “Month of Created Date” column so it’s the first column in your Result Table.
-
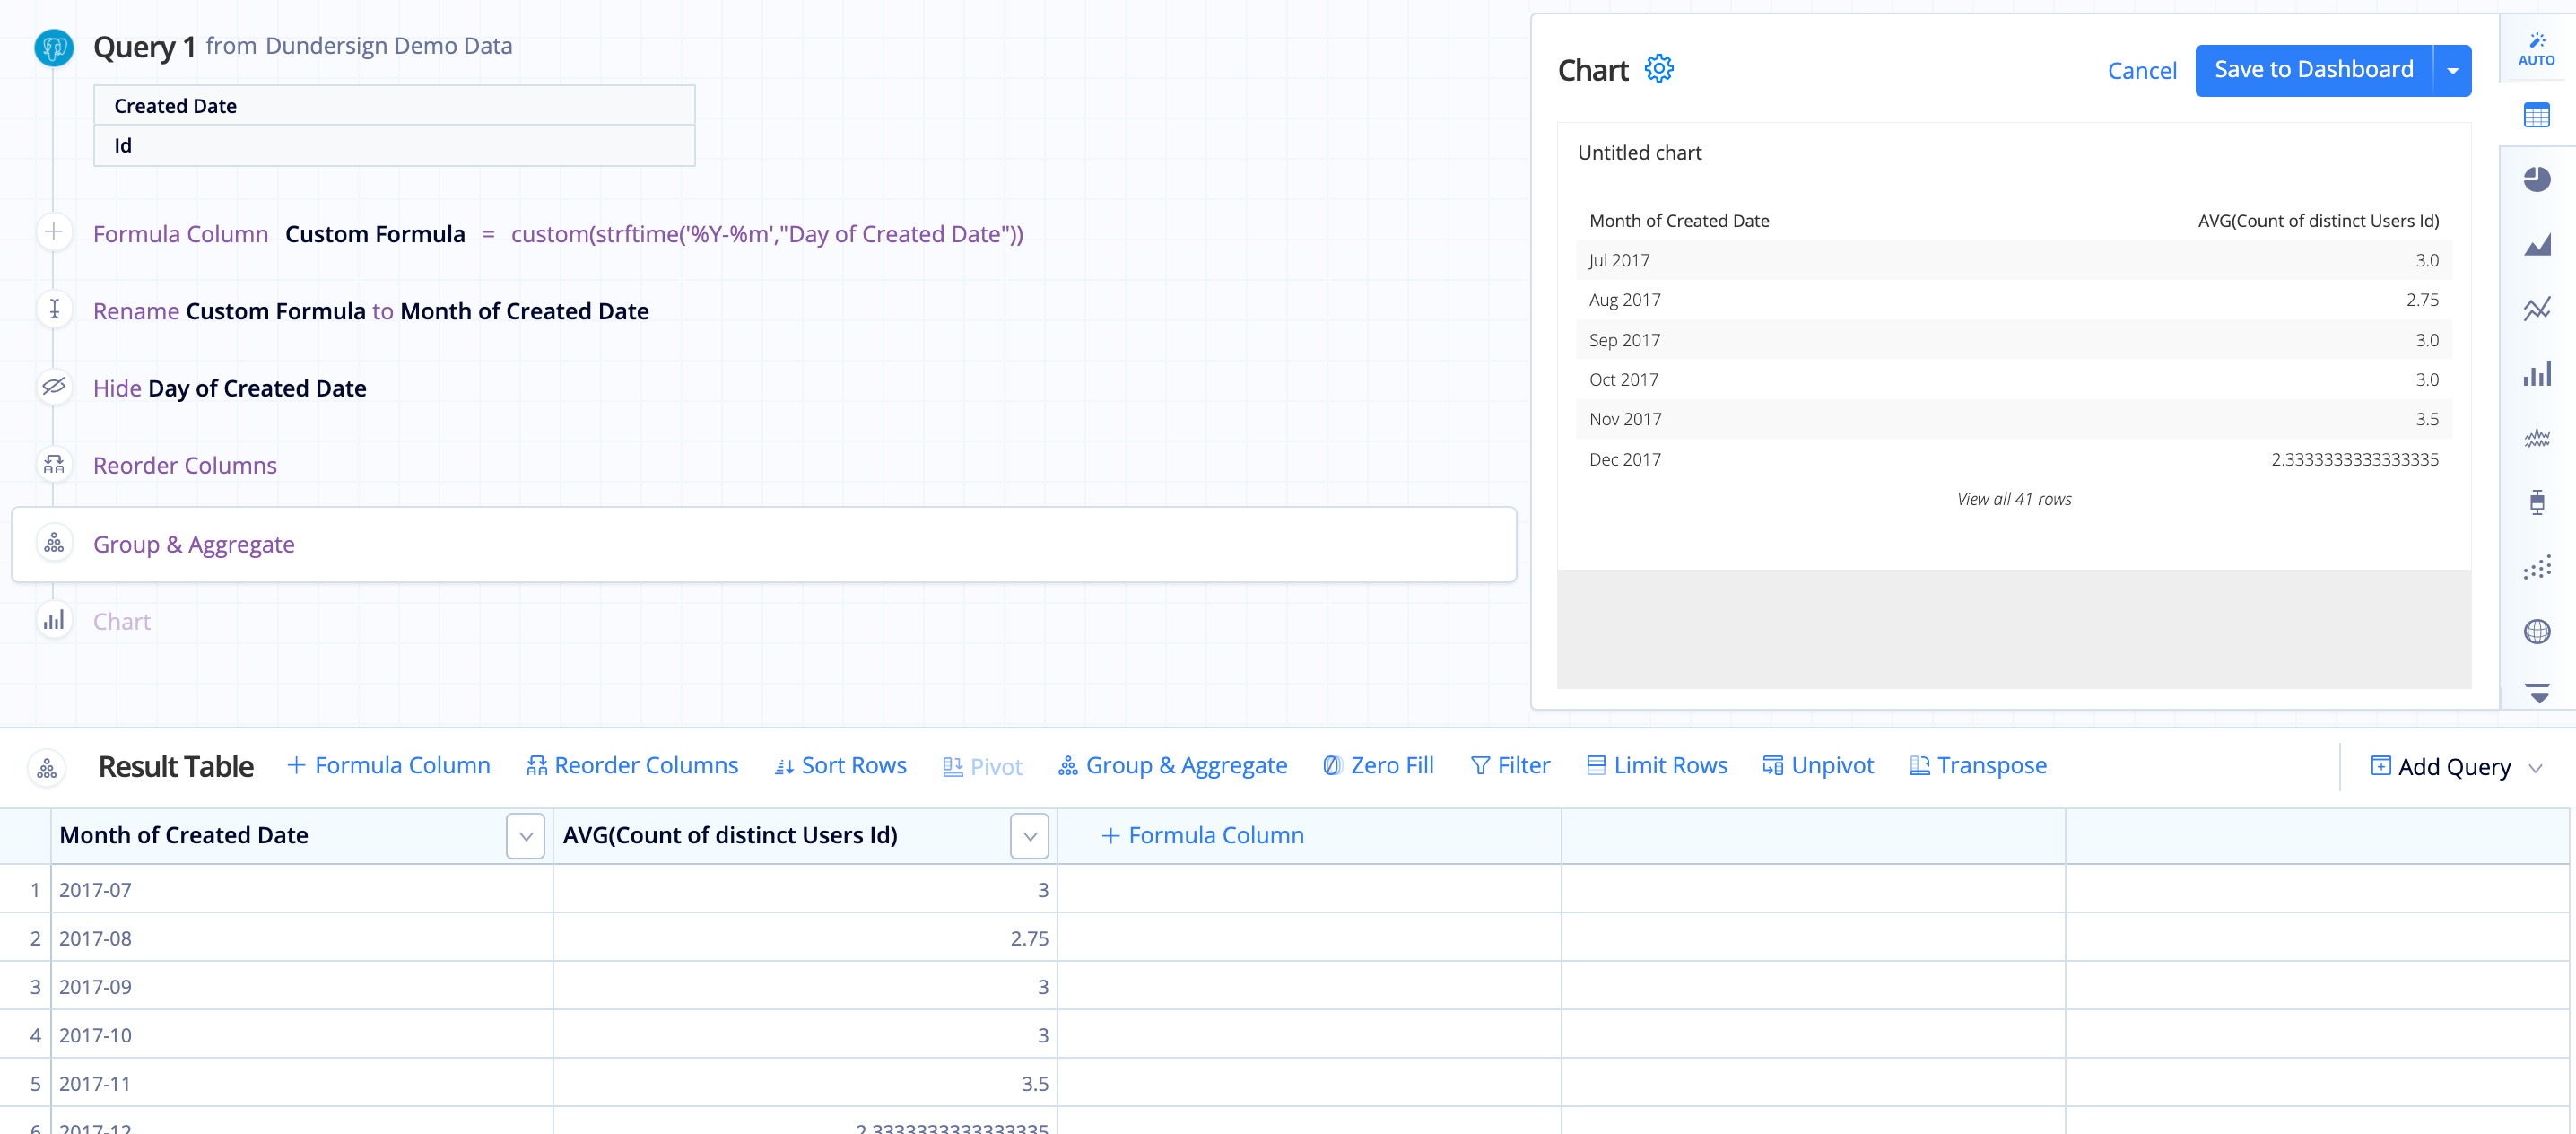
And now for the most important part: Add a Group & Aggregate Action. We want to choose GROUP as the aggregation for “Month of Created Date” because we’ll use this column to group the “Count of distinct Users Id” by month. Since we want the average count of users, we’ll then choose AVG as the aggregation for the “Count of distinct Users Id” column. Click Save.
This process negates the need to write a nested SELECT statement and can be done in just a few minutes. A full preview of all the steps needed to create this chart can be found below:
