Start a Query in SQL Mode
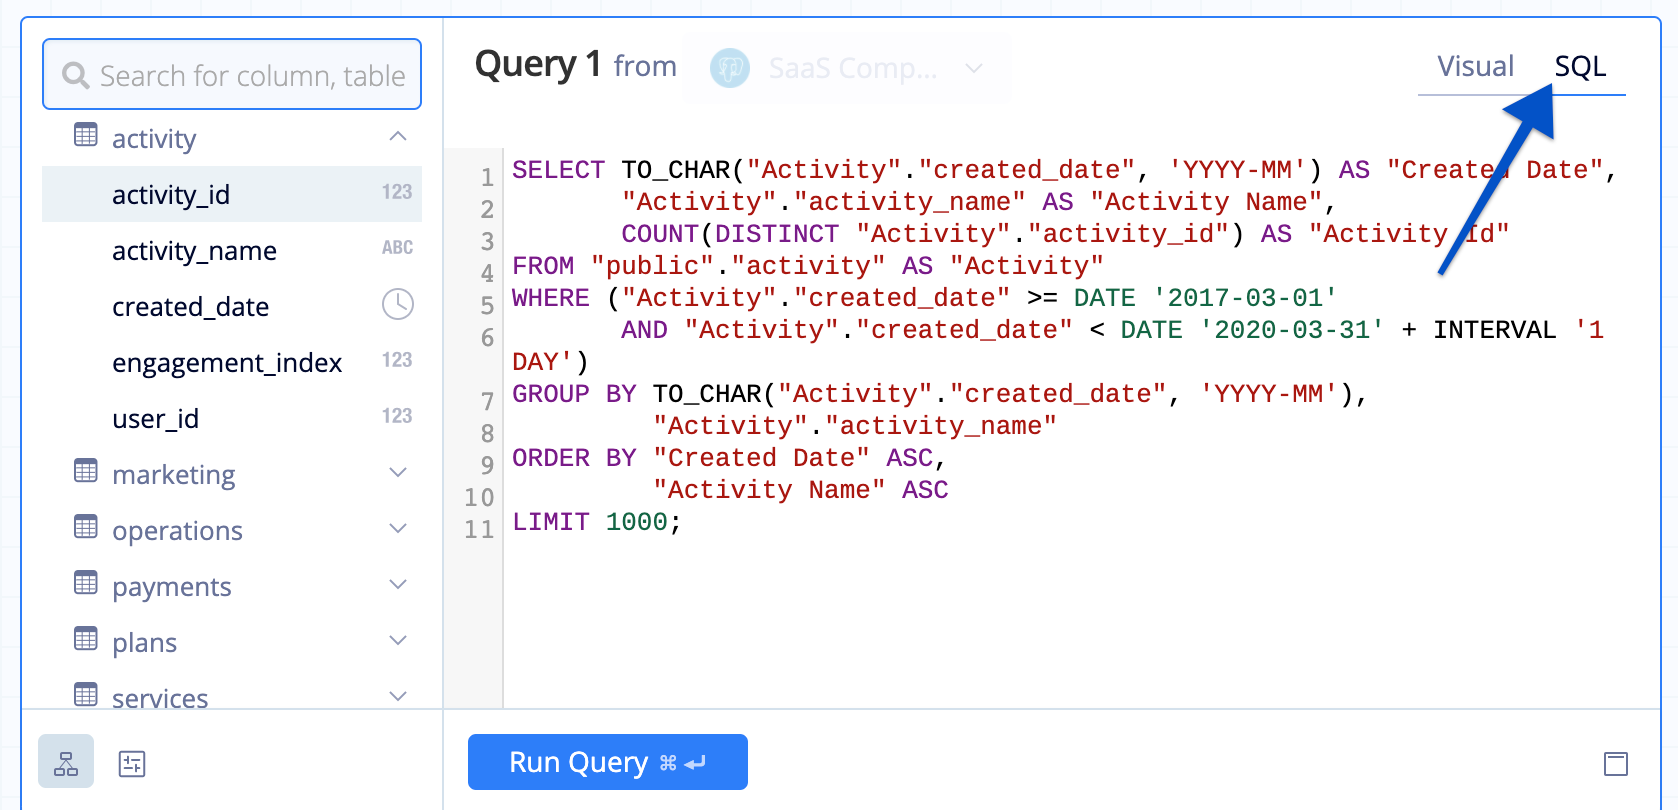
If you feel more comfortable creating SQL queries from scratch, you can do so by using SQL Mode in your Query Action. If you added columns or filters in Visual Mode then switched to SQL Mode, you’ll see the same auto-generated SQL query that also appears in the SQL preview in Visual Mode’s Advanced Drawer. The key difference here is you can edit that SQL query to include more complex SQL functions that may not be feasible to do via Visual Mode.
Tip! Building queries in Visual Mode then switching to SQL Mode is a great way to generate the basic structure of return values and even joins, before editing the query with more specific needs.
Like in Visual Mode, you can only query one data source at a time in SQL Mode. If you’d like to query multiple data sources in your chart, you’ll need to create a Query for each data source then merge those Queries together in the Pipeline.
When using SQL Mode, there are several tabs at the bottom-left of the Query that may come in handy:
SQL syntax
The SQL syntax used for your Query in SQL Mode must be the syntax for your data source’s underlying database type. However, the SQL syntax in all other Actions is SQLite.
Note: Data Stores and CSVs will use PostgreSQL syntax. Also, check out our Google Sheets docs to learn more about Google Sheets SQL Mode syntax.
Keyboard shortcuts! Use Command + Shift + F to nicely format your SQL query.

Autocomplete
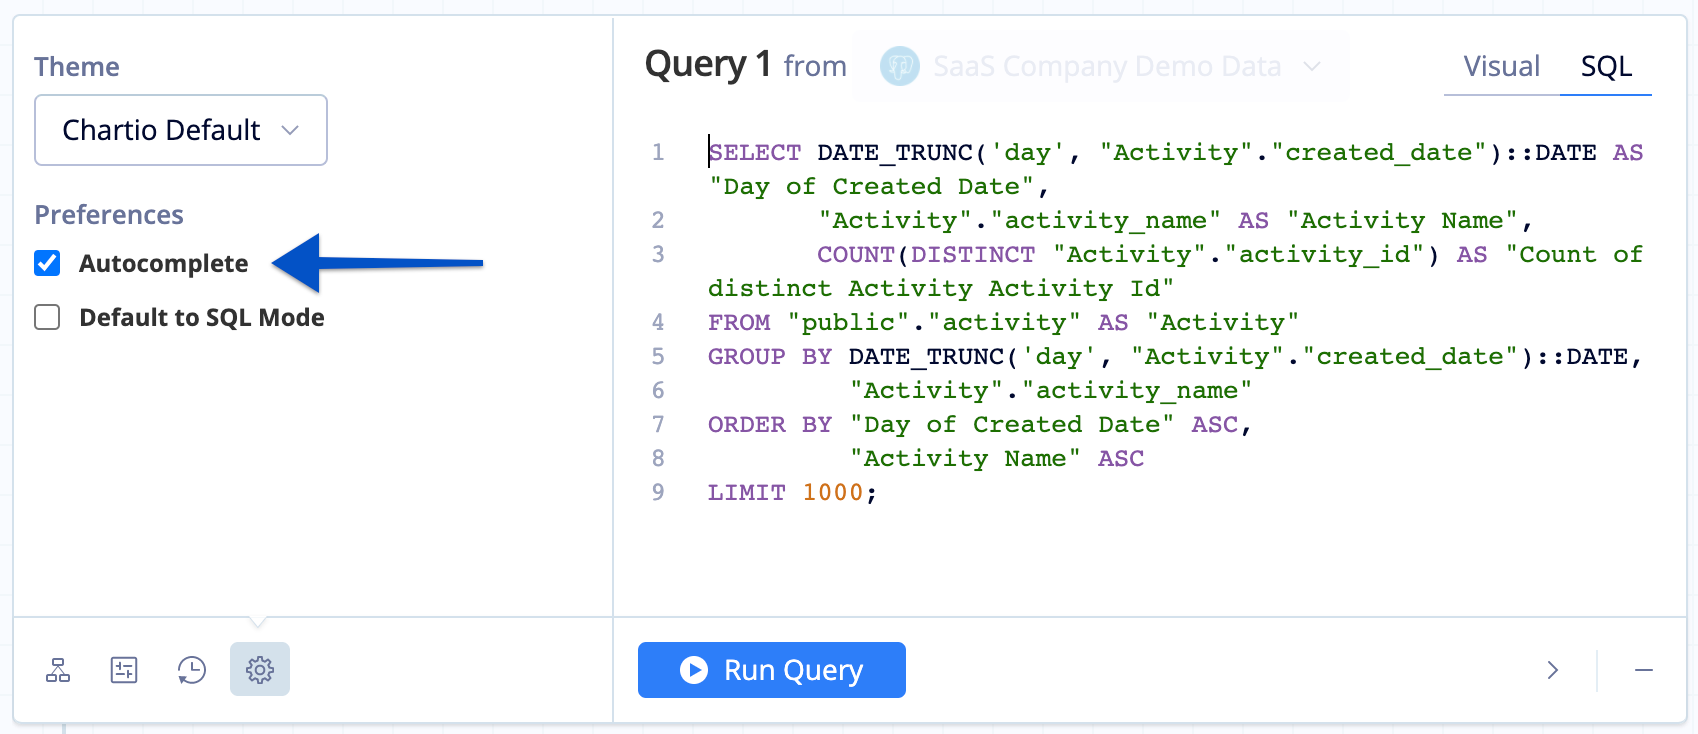
As you type, the convenient autocomplete feature shows basic SQL keywords, tables, and columns available for you to use in your SQL query.
Want to disable the autocomplete feature? Open the SQL Editor Settings tab (Gear icon) and deselect the Autocomplete option.
SQL Mode schema browser
By default, SQL Mode shows the schema browser pane on the left side of the Query. Just like the Visual Mode schema browser, you can see and search through all the schemas, tables, and columns available from your data source. Clicking on a column from the schema browser adds the column name to your SQL query.
Note: The schema, table, and column names shown are the SQL names, not the aliases provided in the data source’s schema.
Controls and Variables browser
Toggle to the Controls and Variables browser to see any available Dashboard Controls and all the Relative Date Variables you can use in your SQL query. Similar to the schema browser, clicking on a Dashboard Control or Relative Date Variable from the list adds the Control or Variable to your SQL query, including the special Chartio-specific syntax you need to properly reference them.
You can create more dynamic date options using Chartio’s datetime functions on date Controls and Relative Date Variables.
Edit Control values
If you’re referencing Dashboard Controls in your query, you can click the Pencil icon at the upper-right corner of the Controls and Variables browser to open the Edit Variable Values modal. From this modal, you can change the values of your Dashboard Controls without having to exit Visual SQL. Upon clicking Ok, your query automatically re-executes to reflect the new Control values. To set your Control values back to the default values, click Reset Values in the bottom-left corner of the modal.
![]()
SQL History
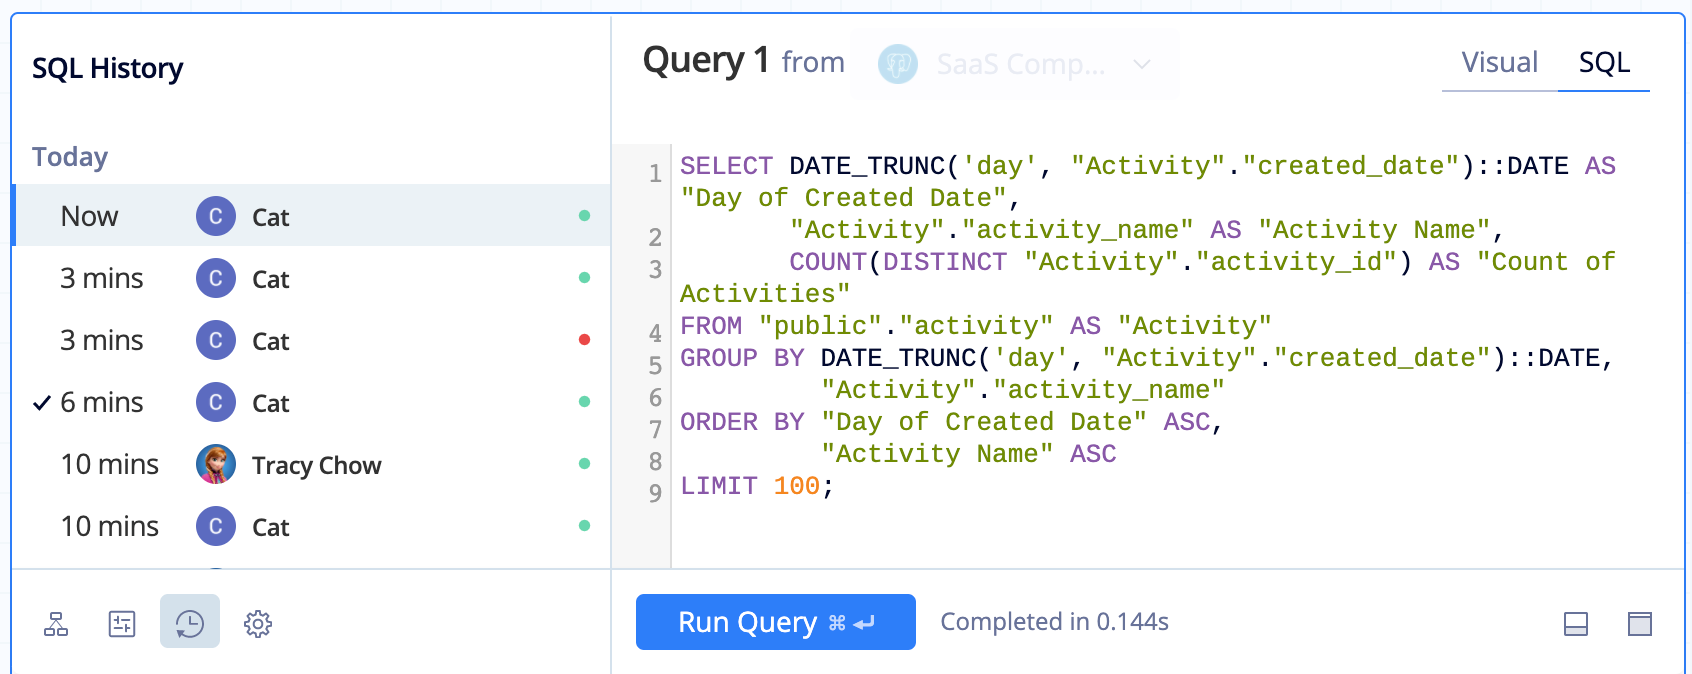
To give you some peace of mind, Chartio has a SQL History tab that acts as a version control system for your SQL Mode queries. It keeps track of your draft queries and all executed SQL Mode queries for the chart, so you can quickly and easily view, revert, or build on a previously executed query.
The SQL History entries are listed from most to least recent and go all the way back to the very first SQL query for the chart. Each entry shows:
- the query’s execution timestamp,
- the editor of that version,
- a state indicator of the query
- Green dot = successfully executed
- Red dot = executed but failed
- No dot = draft; query was not executed
- Gray dot = saved draft
Note: If you’re editing an auto-generated Visual Mode query, the initial query is not saved to the SQL History list until you manually execute the query in SQL Mode.
The draft you’re actively editing (AKA the working version) is always the first entry in the SQL History list, and the timestamp always shows “Now”. If your working version differs from the most recently executed query, you haven’t executed it, and you save the chart to the dashboard, that draft is saved to the SQL History. Otherwise, drafts are not saved.
The most recent version that was saved to the dashboard has a check mark to the left of the query’s timestamp.

You can preview a previous version by hovering over its entry; the SQL in the editor will update with that version’s code. From there, you could either jump back to your working version to continue editing your existing query or click the previous version to start editing its SQL. Doing the latter creates a new working version, so your initial one is still recoverable.
SQL editor settings
Click the Gear icon near the bottom-left corner of the Query to navigate to the SQL Editor Settings tab, where you can customize your SQL IDE experience.
SQL editor themes
Changing the theme changes the colors of the SQL editor code and background. Choose the theme that suits your preference:
- Chartio Default
- Chartio Classic
- Darcula
Enable or disable Autocomplete
Enable or disable the SQL autocomplete feature

Default to SQL Mode
Selecting this option opens new charts and new Queries in SQL Mode by default—super convenient for power users!
Resize SQL editor
If the normal view of the SQL Mode editor seems a bit cramped, you can expand the SQL editor to give yourself more room to write your SQL query. At the bottom of the Query and click the Maximize icon at the bottom-left corner or click the Collapse chart button to the far-right above the list of chart types. This hides the chart preview to make more space for creating your SQL query.
Tip! Need even more space? Try resizing the Result Table to maximize your SQL editor even further.
To preview the final chart while the SQL Mode editor is maximized, you can hover over any of the chart types or the Show chart button (same location as the “Collapse chart” button).
To show the chart preview pane again, you can do any one of the following:
- Click the “Show chart” button
- Switch back to the Normal view by clicking the Normal icon (same location as the Maximize icon)
- Collapse the Query