Dropdown
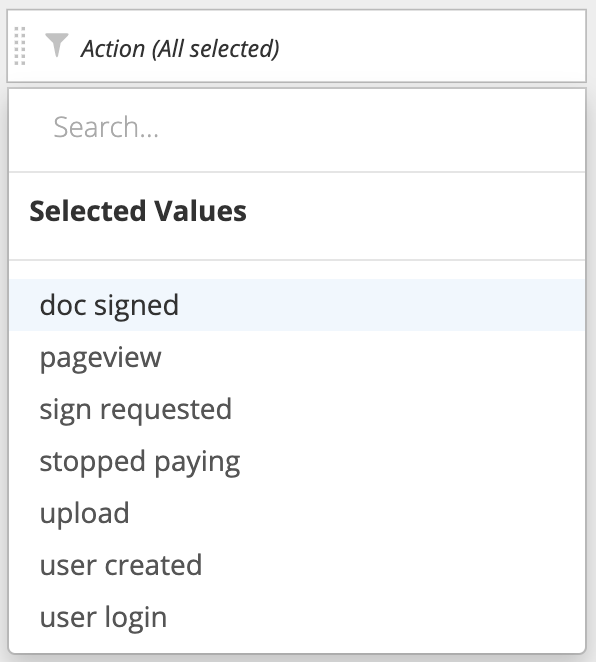
Dropdowns allow you to display values of a query into a searchable list and filter your charts based on the selected values.
In the Visual SQL interface
Create a Dropdown
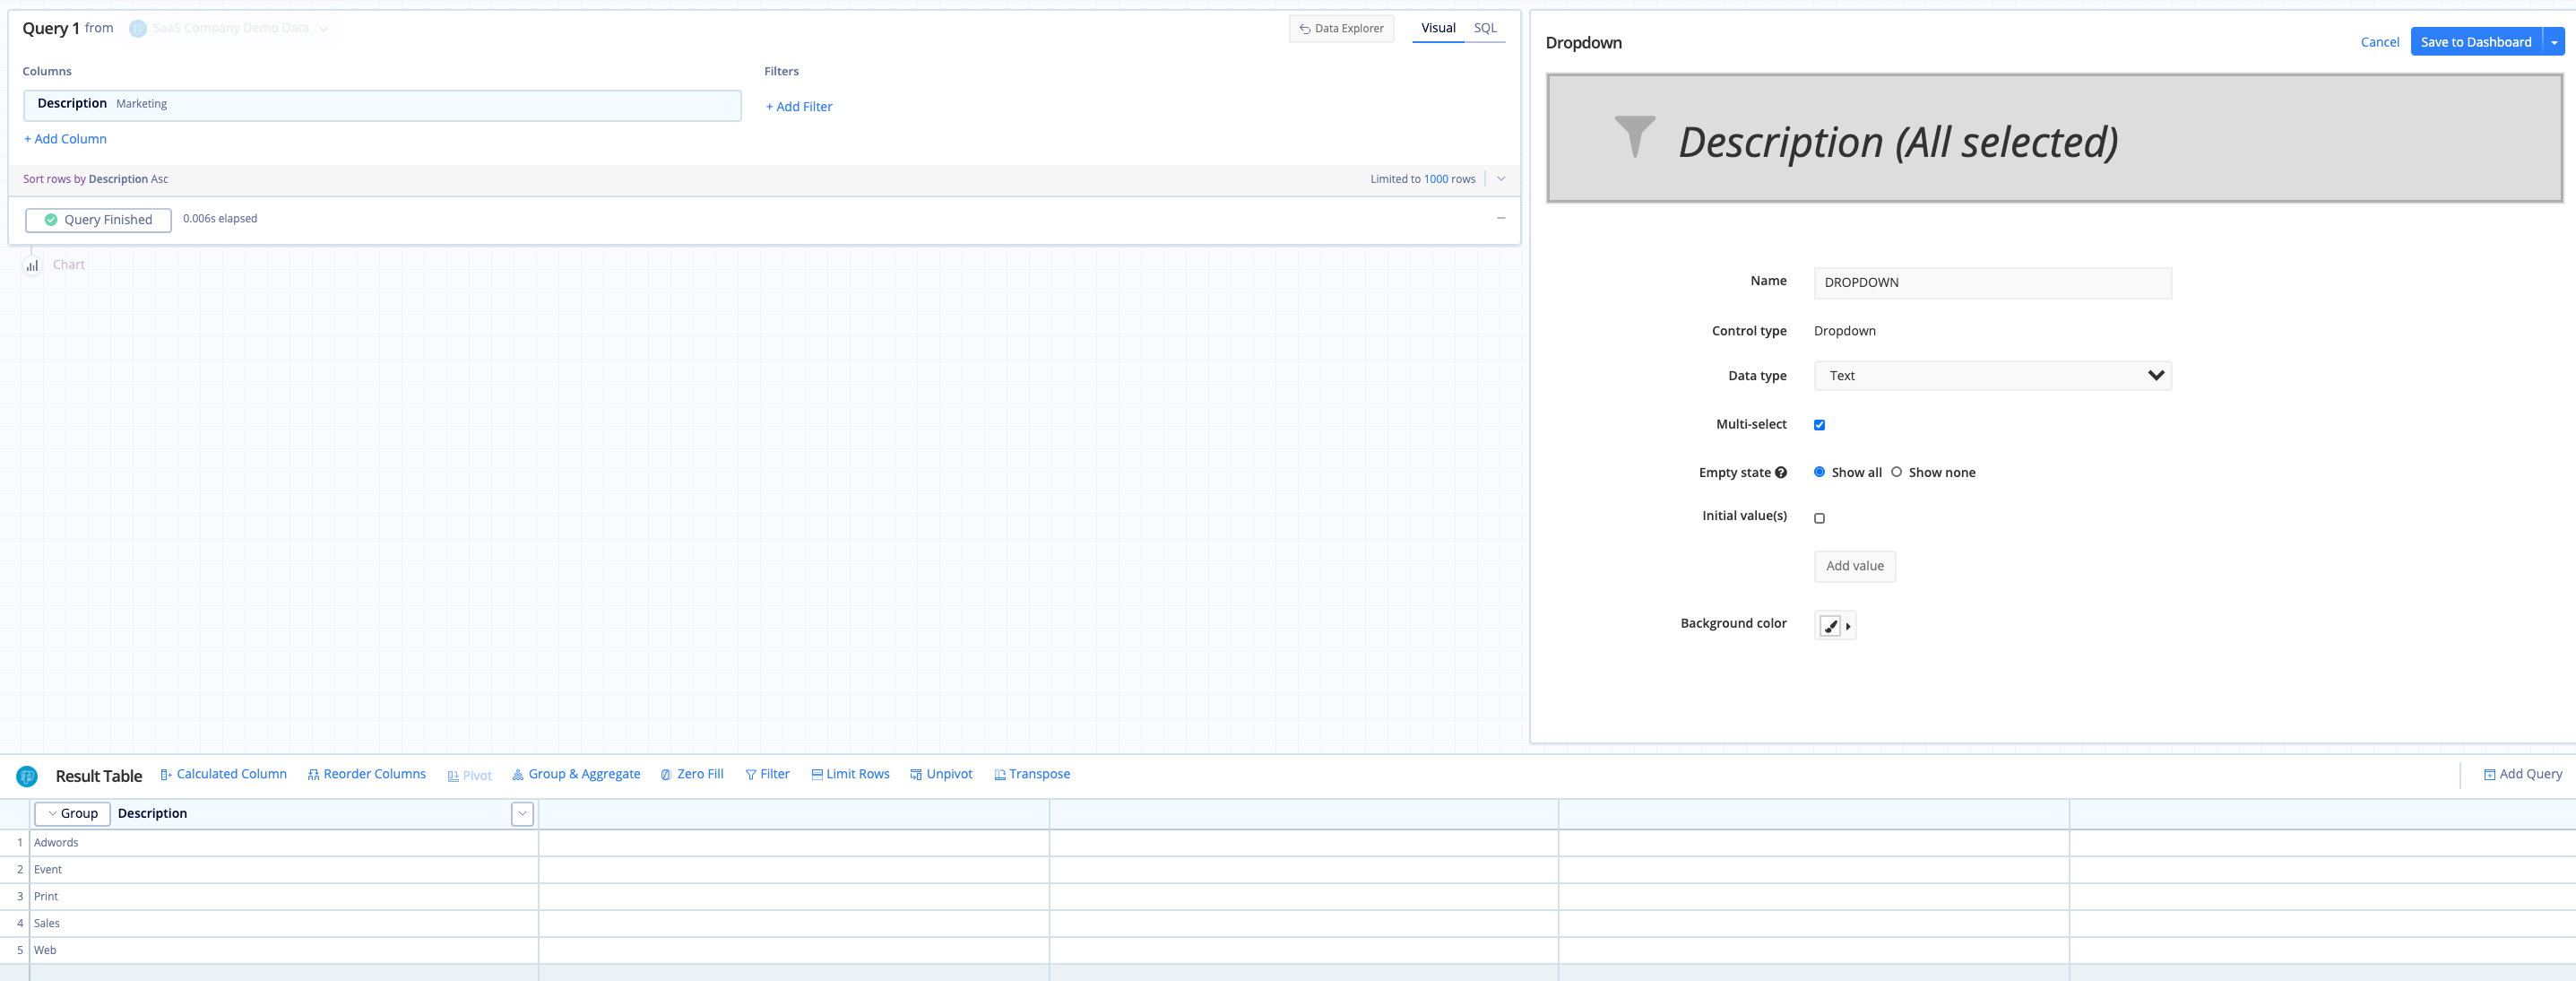
Click Add Control from the dashboard sidebar menu and select Dropdown. You’ll be redirected to Visual SQL. Add the column you want to use for your category. The values in that column will populate a dropdown menu, which you can use to filter your charts. Modify your Dropdown settings as needed.
Tip! You can drag a second categorical column to your Dropdown to display one value but filter by another. Check out our tutorial on key-value pairs in a categorical Dropdown.
Connect a Dropdown to a chart
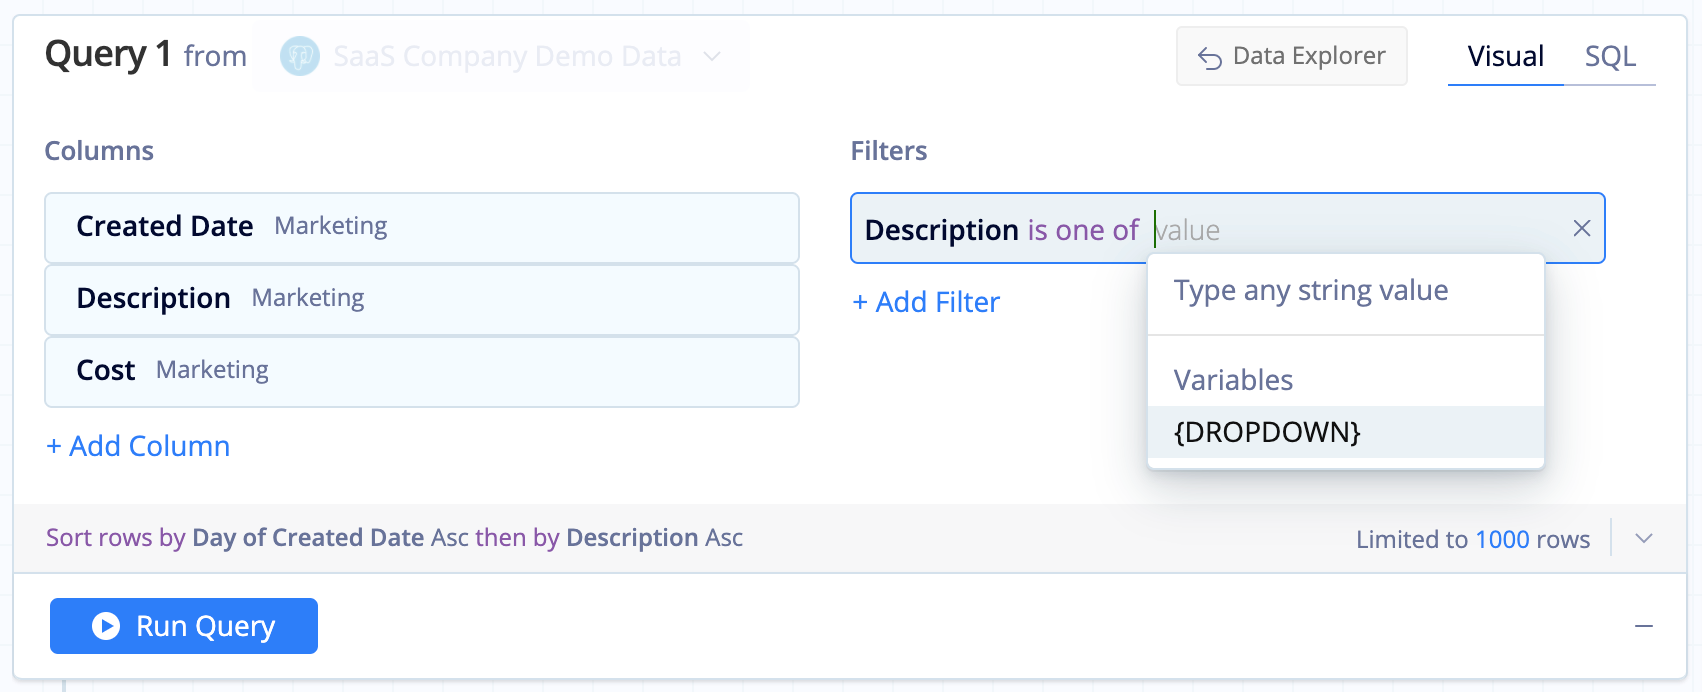
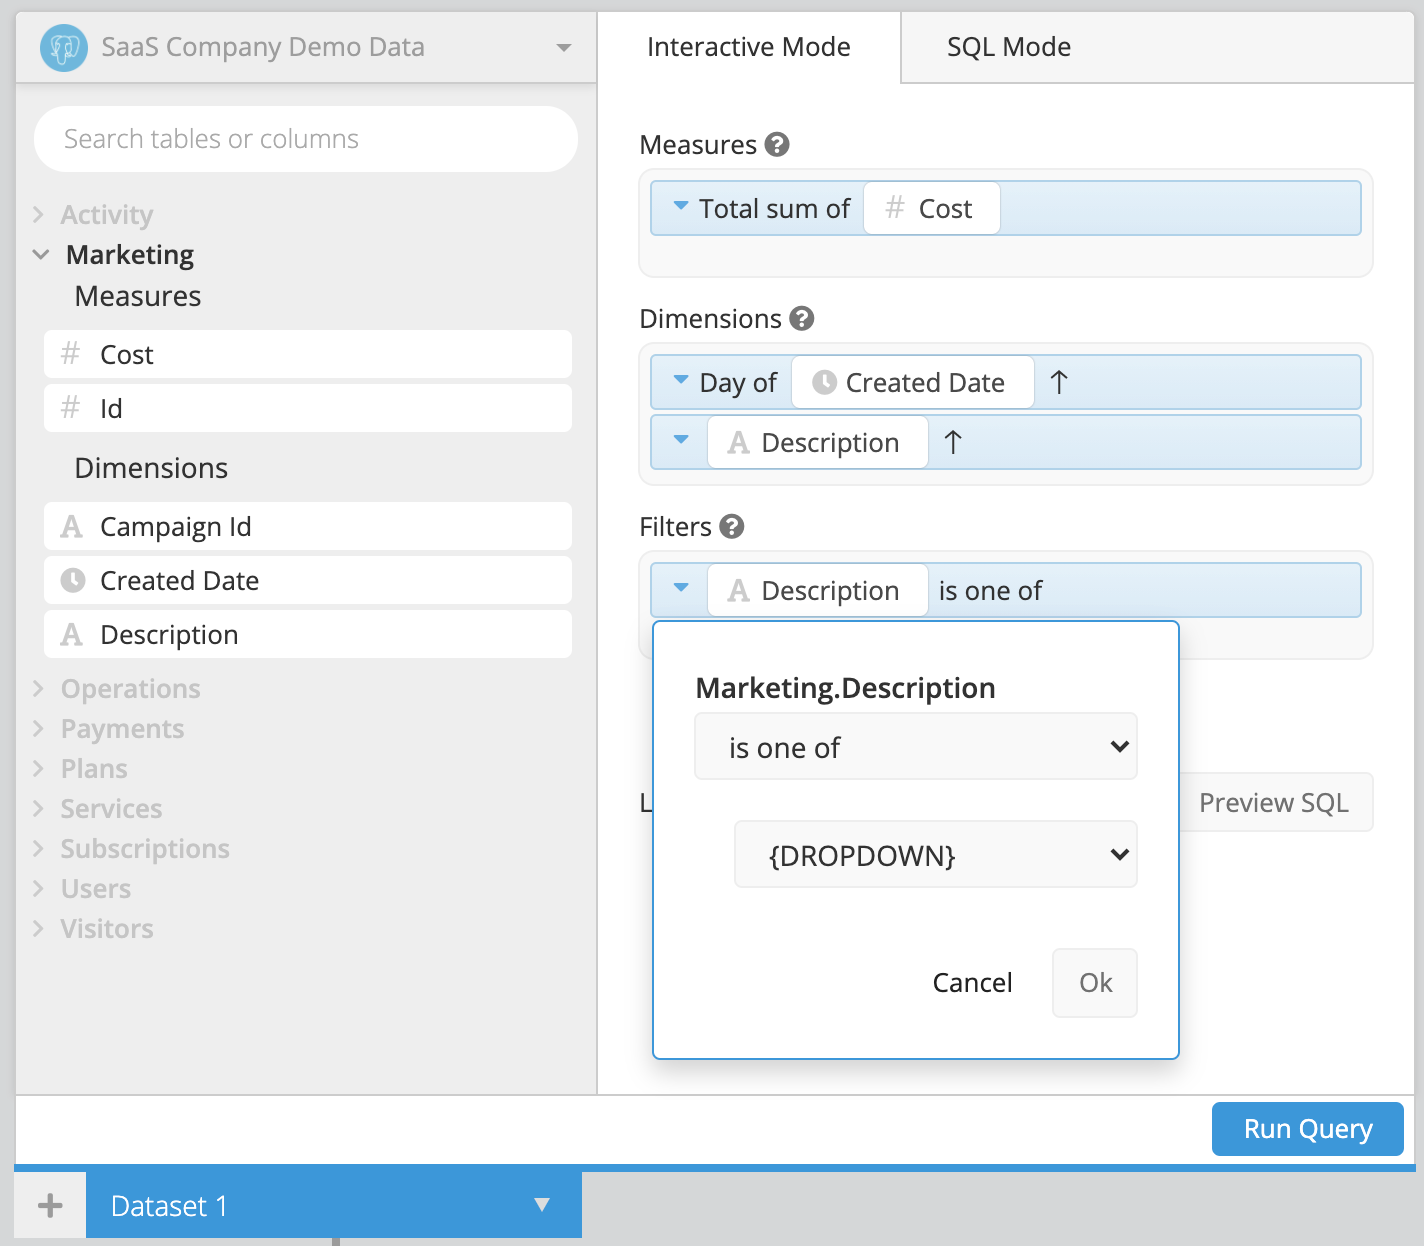
Open the chart you’d like to connect to your Dropdown in Visual SQL. Add the column you want to filter your result set on to the Filters section, select the filter operator, and select your Control name.
A couple of things to keep in mind:
- Your Dropdown must have the same data type as the column you’re filtering on.
- Your filter operator must match the type of Dropdown you’re using. For example, if you’ve left Multi-select deselected in the Dropdown’s settings, make sure you don’t use filter operator “is one of”.
Using SQL Mode? Check out how to reference multi-select Dropdowns in SQL Mode queries.
In the Data Explorer interface
Create a Dropdown
Click Add Control from the dashboard sidebar menu and select Dropdown. You’ll be redirected to the Data Explorer. Find the column you want to use for your category and drag it to the Dimensions field. The values in that column will populate a dropdown menu, which you can use to filter your charts. Modify your Dropdown settings as needed.
Tip! You can drag a second categorical column to your Dropdown to display one value but filter by another. Check out our tutorial on key-value pairs in a categorical Dropdown.
Connect a Dropdown to a chart
Open the chart you’d like to connect to your Dropdown in the Data Explorer. Drag the column you want to filter your dataset on into the Filters section, select the filter type, and select your Control name.
A couple of things to keep in mind:
- Your Dropdown must have the same data type as the column you’re filtering on.
- Your filter type must match the type of Dropdown you’re using. For example, if you’ve left Multi-select unchecked in the Dropdown’s settings, make sure you don’t use filter type “is one of”.
Using SQL Mode? Check out how to reference multi-select Dropdowns in SQL Mode queries.
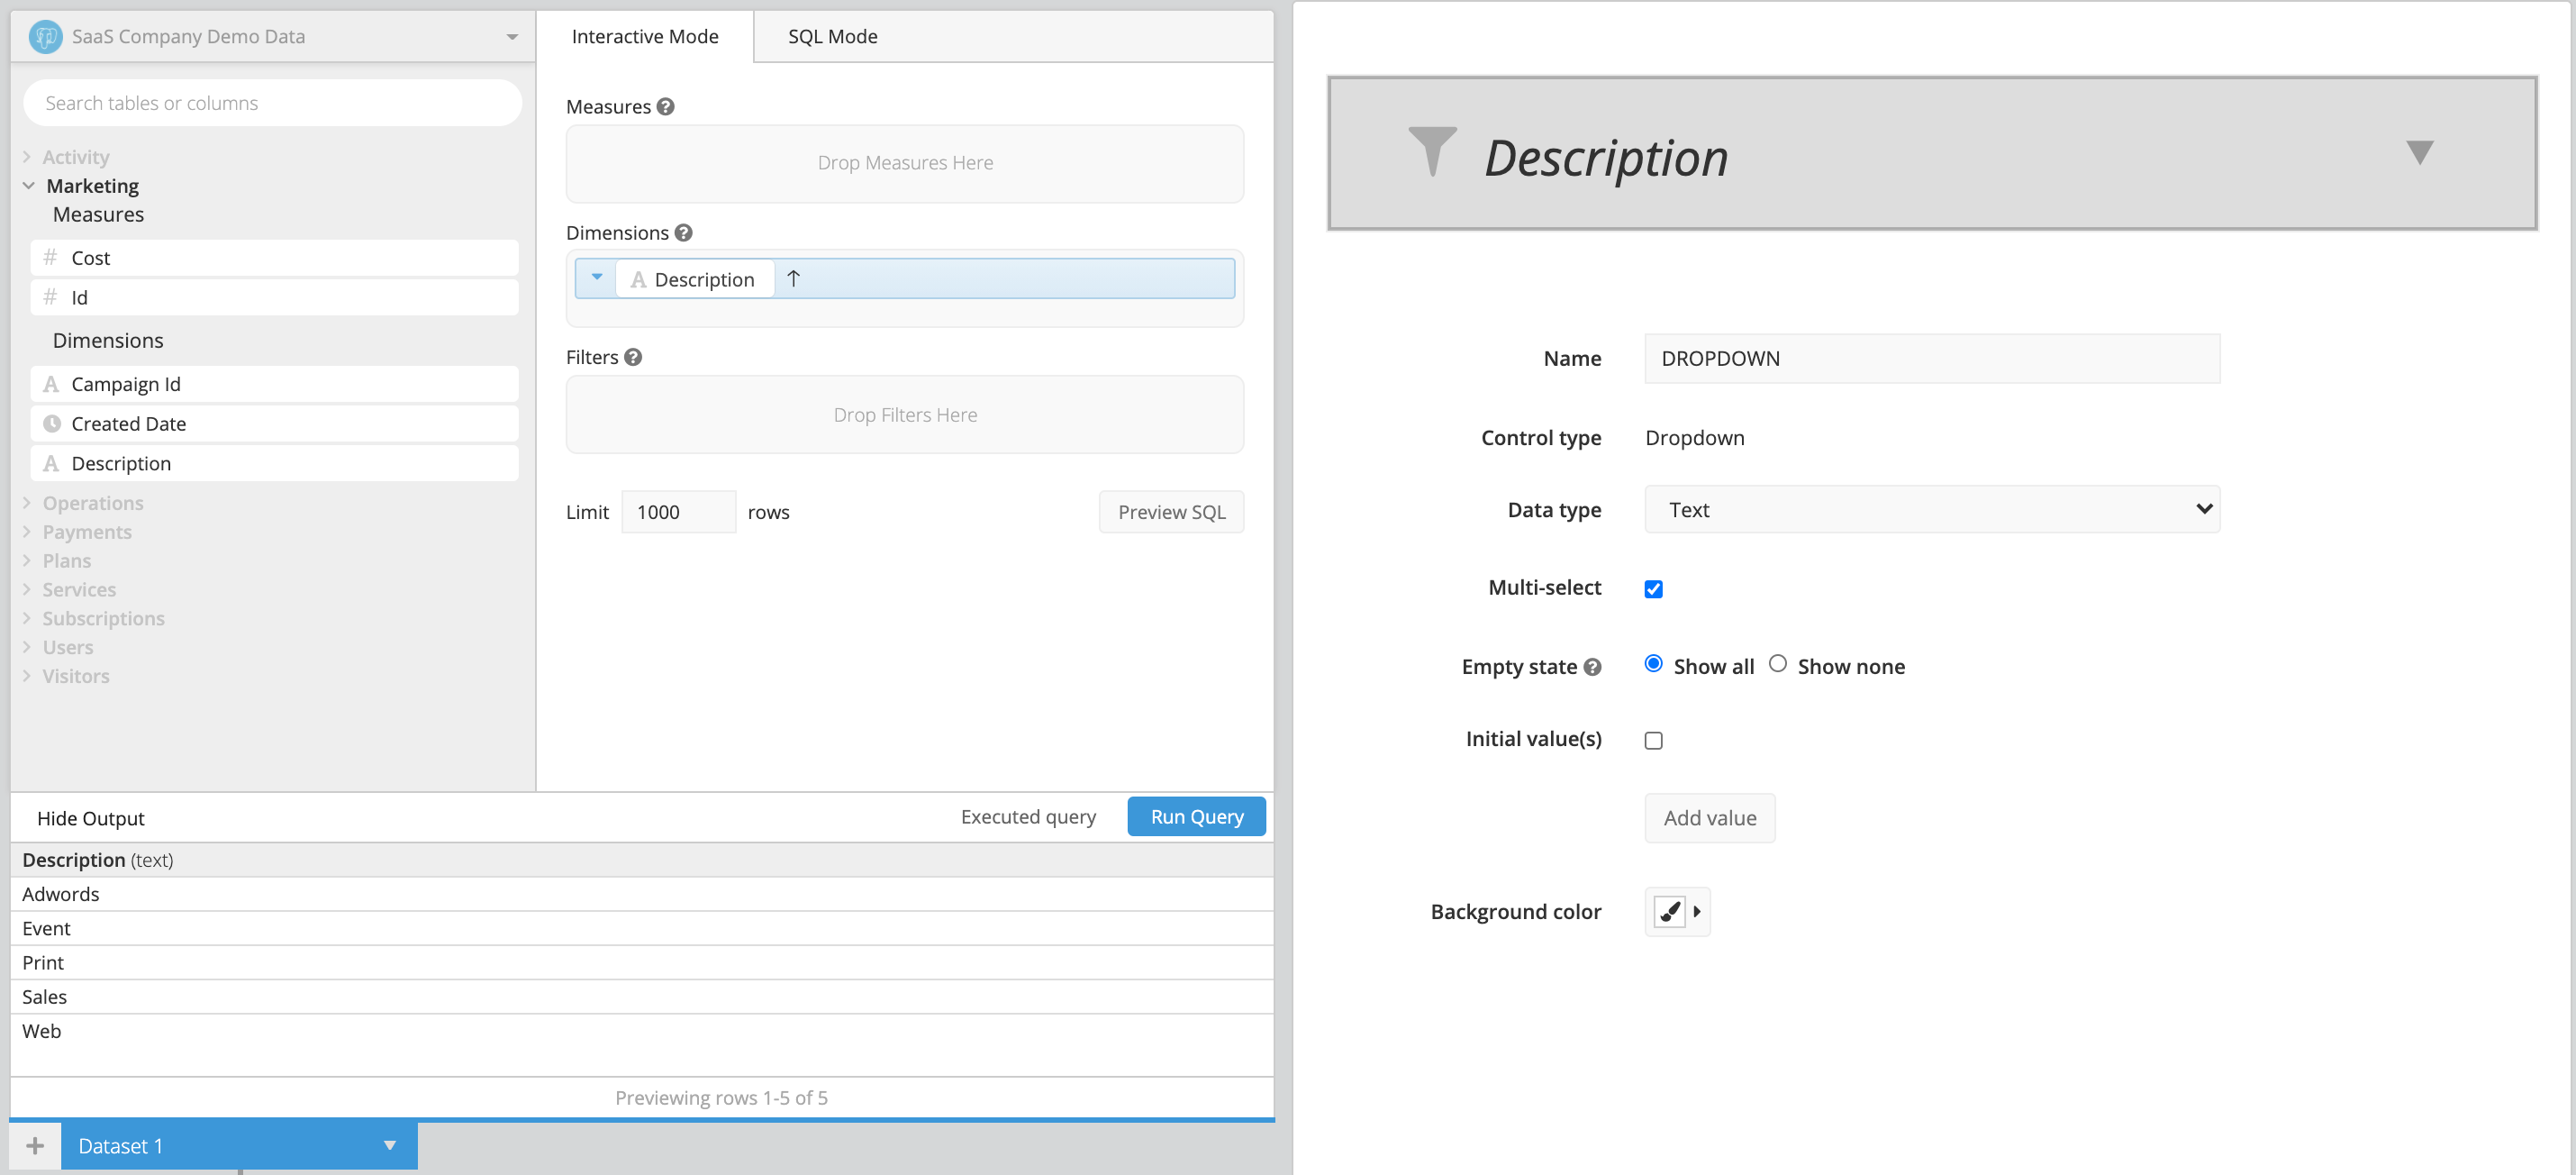
Dropdown settings
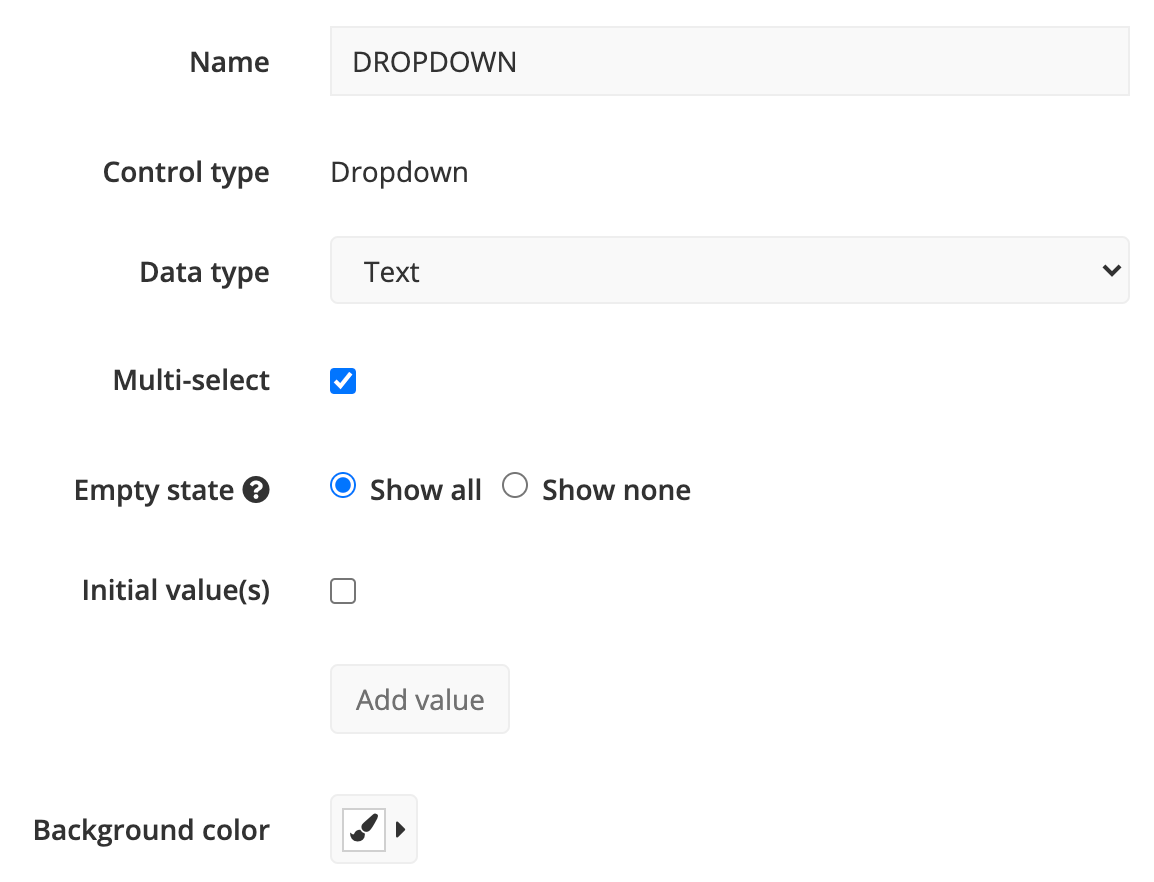
- Data type: Select the data type for your Dropdown’s results (Text, Number, Boolean, Date).
- Multi-select: Select to allow filtering by multiple values at once. If selecting Multi-select, make sure to use the “is one of” filter operator in your connected charts, not “equals” or “like”.
-
Empty state: When no values are selected in the Dropdown, you can either Show all rows in the attached charts or Show none. This option is only available for multi-select Dropdowns.
If you’d like to learn more, check out our FAQ explaining how the “Show All” option works.
- Initial value(s): Select to set default Dropdown value(s) on load.
