Embedding a Dashboard
Embedding Analytics is an added feature that you can purchase for your existing Chartio plan. If you’re interested in adding this feature or want to learn more, please reach out to support@chartio.com.
Once a dashboard is created, it shouldn’t take too long to embed it into your application. Follow the steps below to embed a Chartio dashboard into your application.
- If you’re trying to embed a dashboard in websites like Confluence or Salesforce, you’ll need to follow slightly different instructions—check out our Internal Embedding page for more information.
- If you’re still using the old version, you can still reference those instructions here.
Permissions required: Dashboard Admin
1. Retrieve the dashboard embedding example code
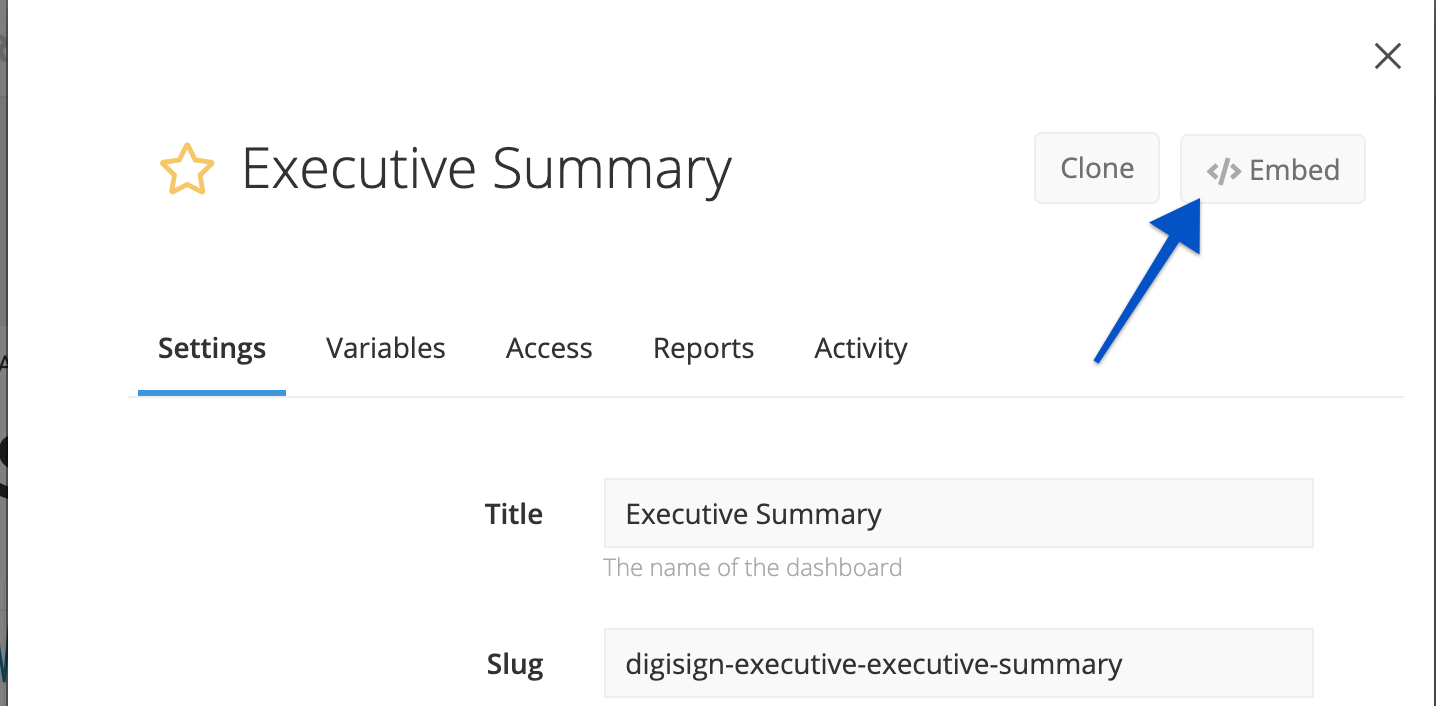
Navigate to a dashboard you wish to embed, then open Settings from the dashboard sidebar and click the Embed button at the top-right of the modal.

This brings you to the dashboard’s Embedding page, where you can see the dashboard example code in four languages:
- Python
- Ruby
- Javascript (Node.js)
- PHP
For the following examples, we’ll use Python code.

Note: By default, viewers of embedded dashboards cannot change dashboard filters. To allow changing dashboard filters, refer to the Enable use of Dashboard Controls section of our Embedding page.
2. Retrieve the Embed Secret
All embedding will be encrypted by your organization’s unique Embed Secret. Find the Embed Secret by going to your organization’s Dashboard Embedding page; your Embed Secret will appear here. Keep it handy as we will refer to it in the next steps.
Note: Owner access is required to view the Embed Secret.

3. Install a third-party JWT library
We accept requests for the embedded dashboard using the JSON Web Token (JWT) standard. We recommend JWTs can be generated by following the procedure defined here; however, using a third-party library is recommended to reduce the chance for error.
In Python, for example, you can simply install the pyjwt library using:
pip install pyjwt
Need help finding a third-party library for your language? jwt.io provides a list of libraries for 30+ languages with support for reading/writing JWTs.
4. Construct a payload
Construct a payload using the dashboard example code as a reference.
A payload should include the following:
organization: Your Chartio organization ID;-
dashboard: Either the slug or the ID of the dashboard to be embedded;Note: Wrap the dashboard slug in double quotes; dashboard ID doesn’t require any quotes.
-
exp(required): An expiration value that specifies when the token expires. The default (and max) value is 24 hours, but it can be set lower.We recommend setting the
expvalue to the average length of a session on the dashboard. If the user stays on the page past the expiration, they’ll need to refresh the page -
env: A mapping of Control names to values which will be passed to the Dashboard Controls on the dashboard.You can pass variables from your Web application too;
Example Python payload:
payload = {
	'organization': 1,
	'dashboard': "my-dash-slug",
	'exp': datetime.utcnow() + timedelta(seconds=900),
	'env': {"MYVAR": 42}
}
Check out our FAQ with payload examples for different scenarios.
Pass variables from your Web application
The values in the env parameter can be sourced from forms submitted to your Web application. This allows the embedded dashboard to be filtered based on UI elements native to your application, providing a familiar interface for users. It also allows the use of UI elements different from what Chartio natively offers.
Below is an example of pulling the env values from a Django form object as well as adding an env value based on session data that is unmodifiable by the end user (ACCT_ID).
env = {k.upper(): str(v) for k, v in form.cleaned_data.items()}
env['ACCT_ID'] = request.session['ACCT_ID']

payload = {
	'dashboard': 38727,
	'organization': 16417,
	'exp': datetime.utcnow() + timedelta(seconds=900),
	'env': env
}
Test your payload
To see how the embedded dashboard looks with different Control or Hidden Variable values, you can do the following:
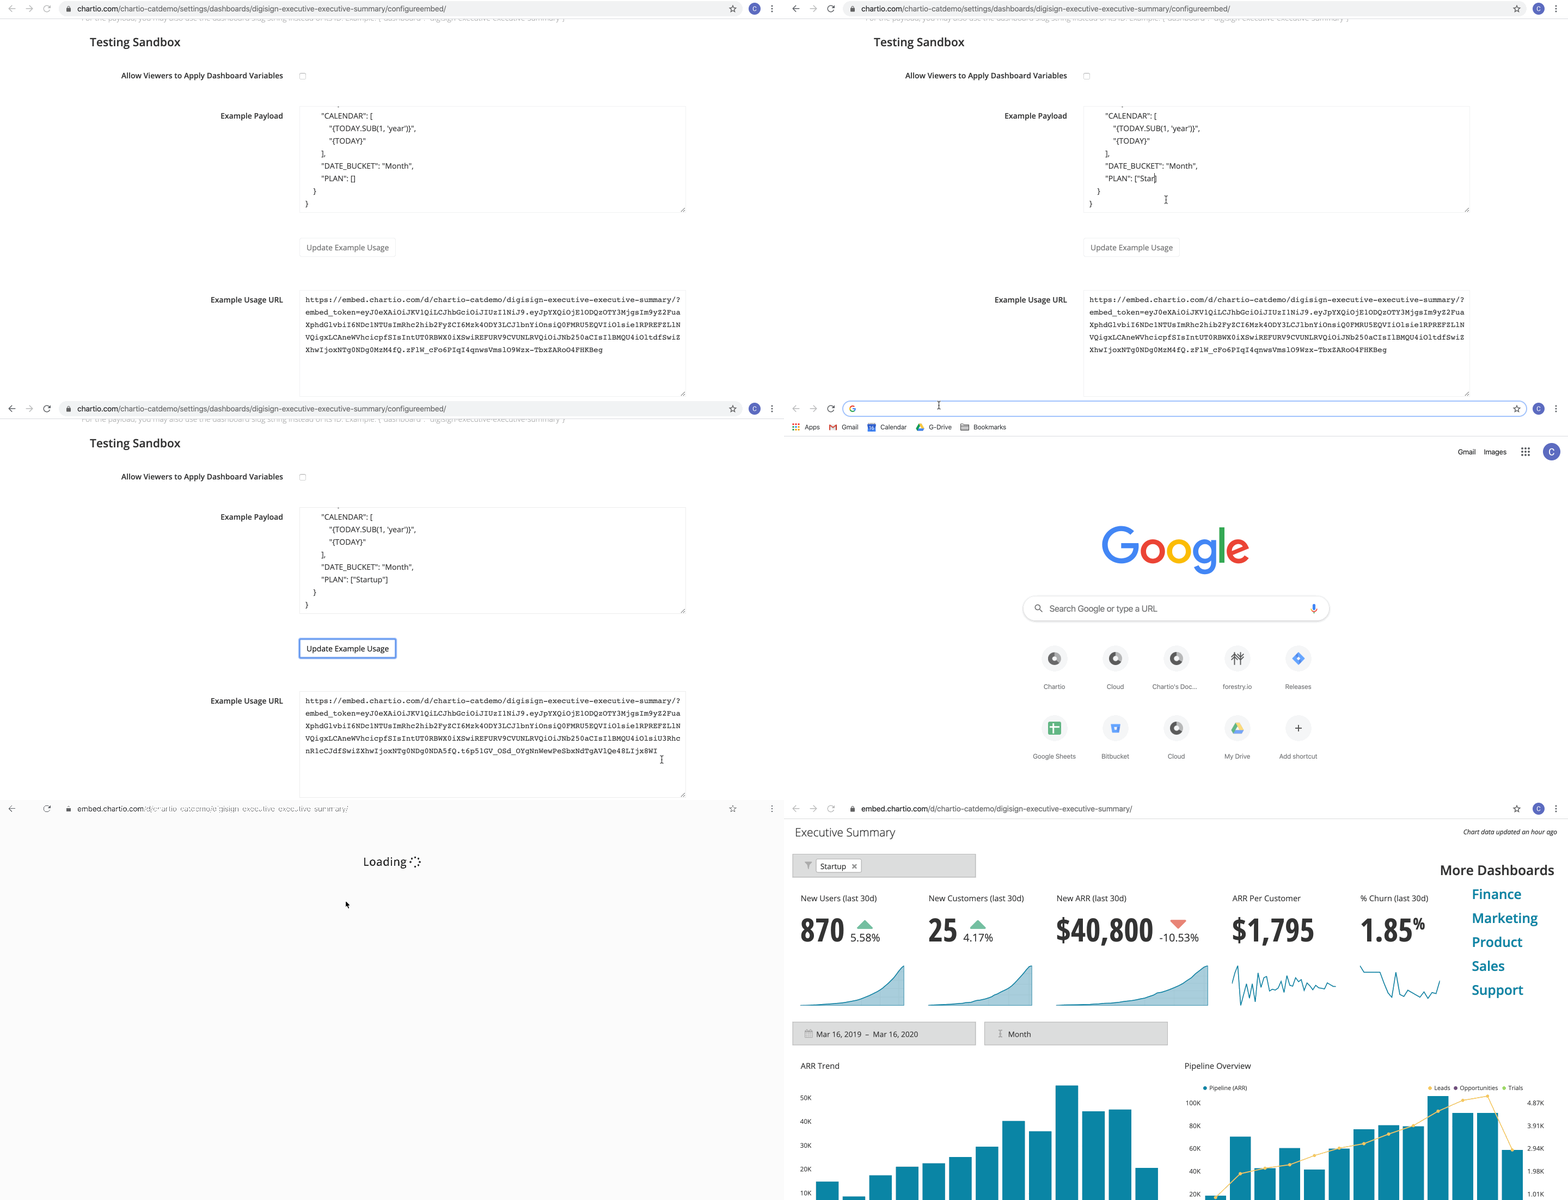
- Edit the Control/Hidden Variable values in the Example Payload under the Testing Sandbox section of the dashboard’s Embed settings.
- Click Update Example Usage. This updates the Example Usage URL. You can then copy and paste this URL in your browser to preview how your embedded dashboard will look using the updated example payload.

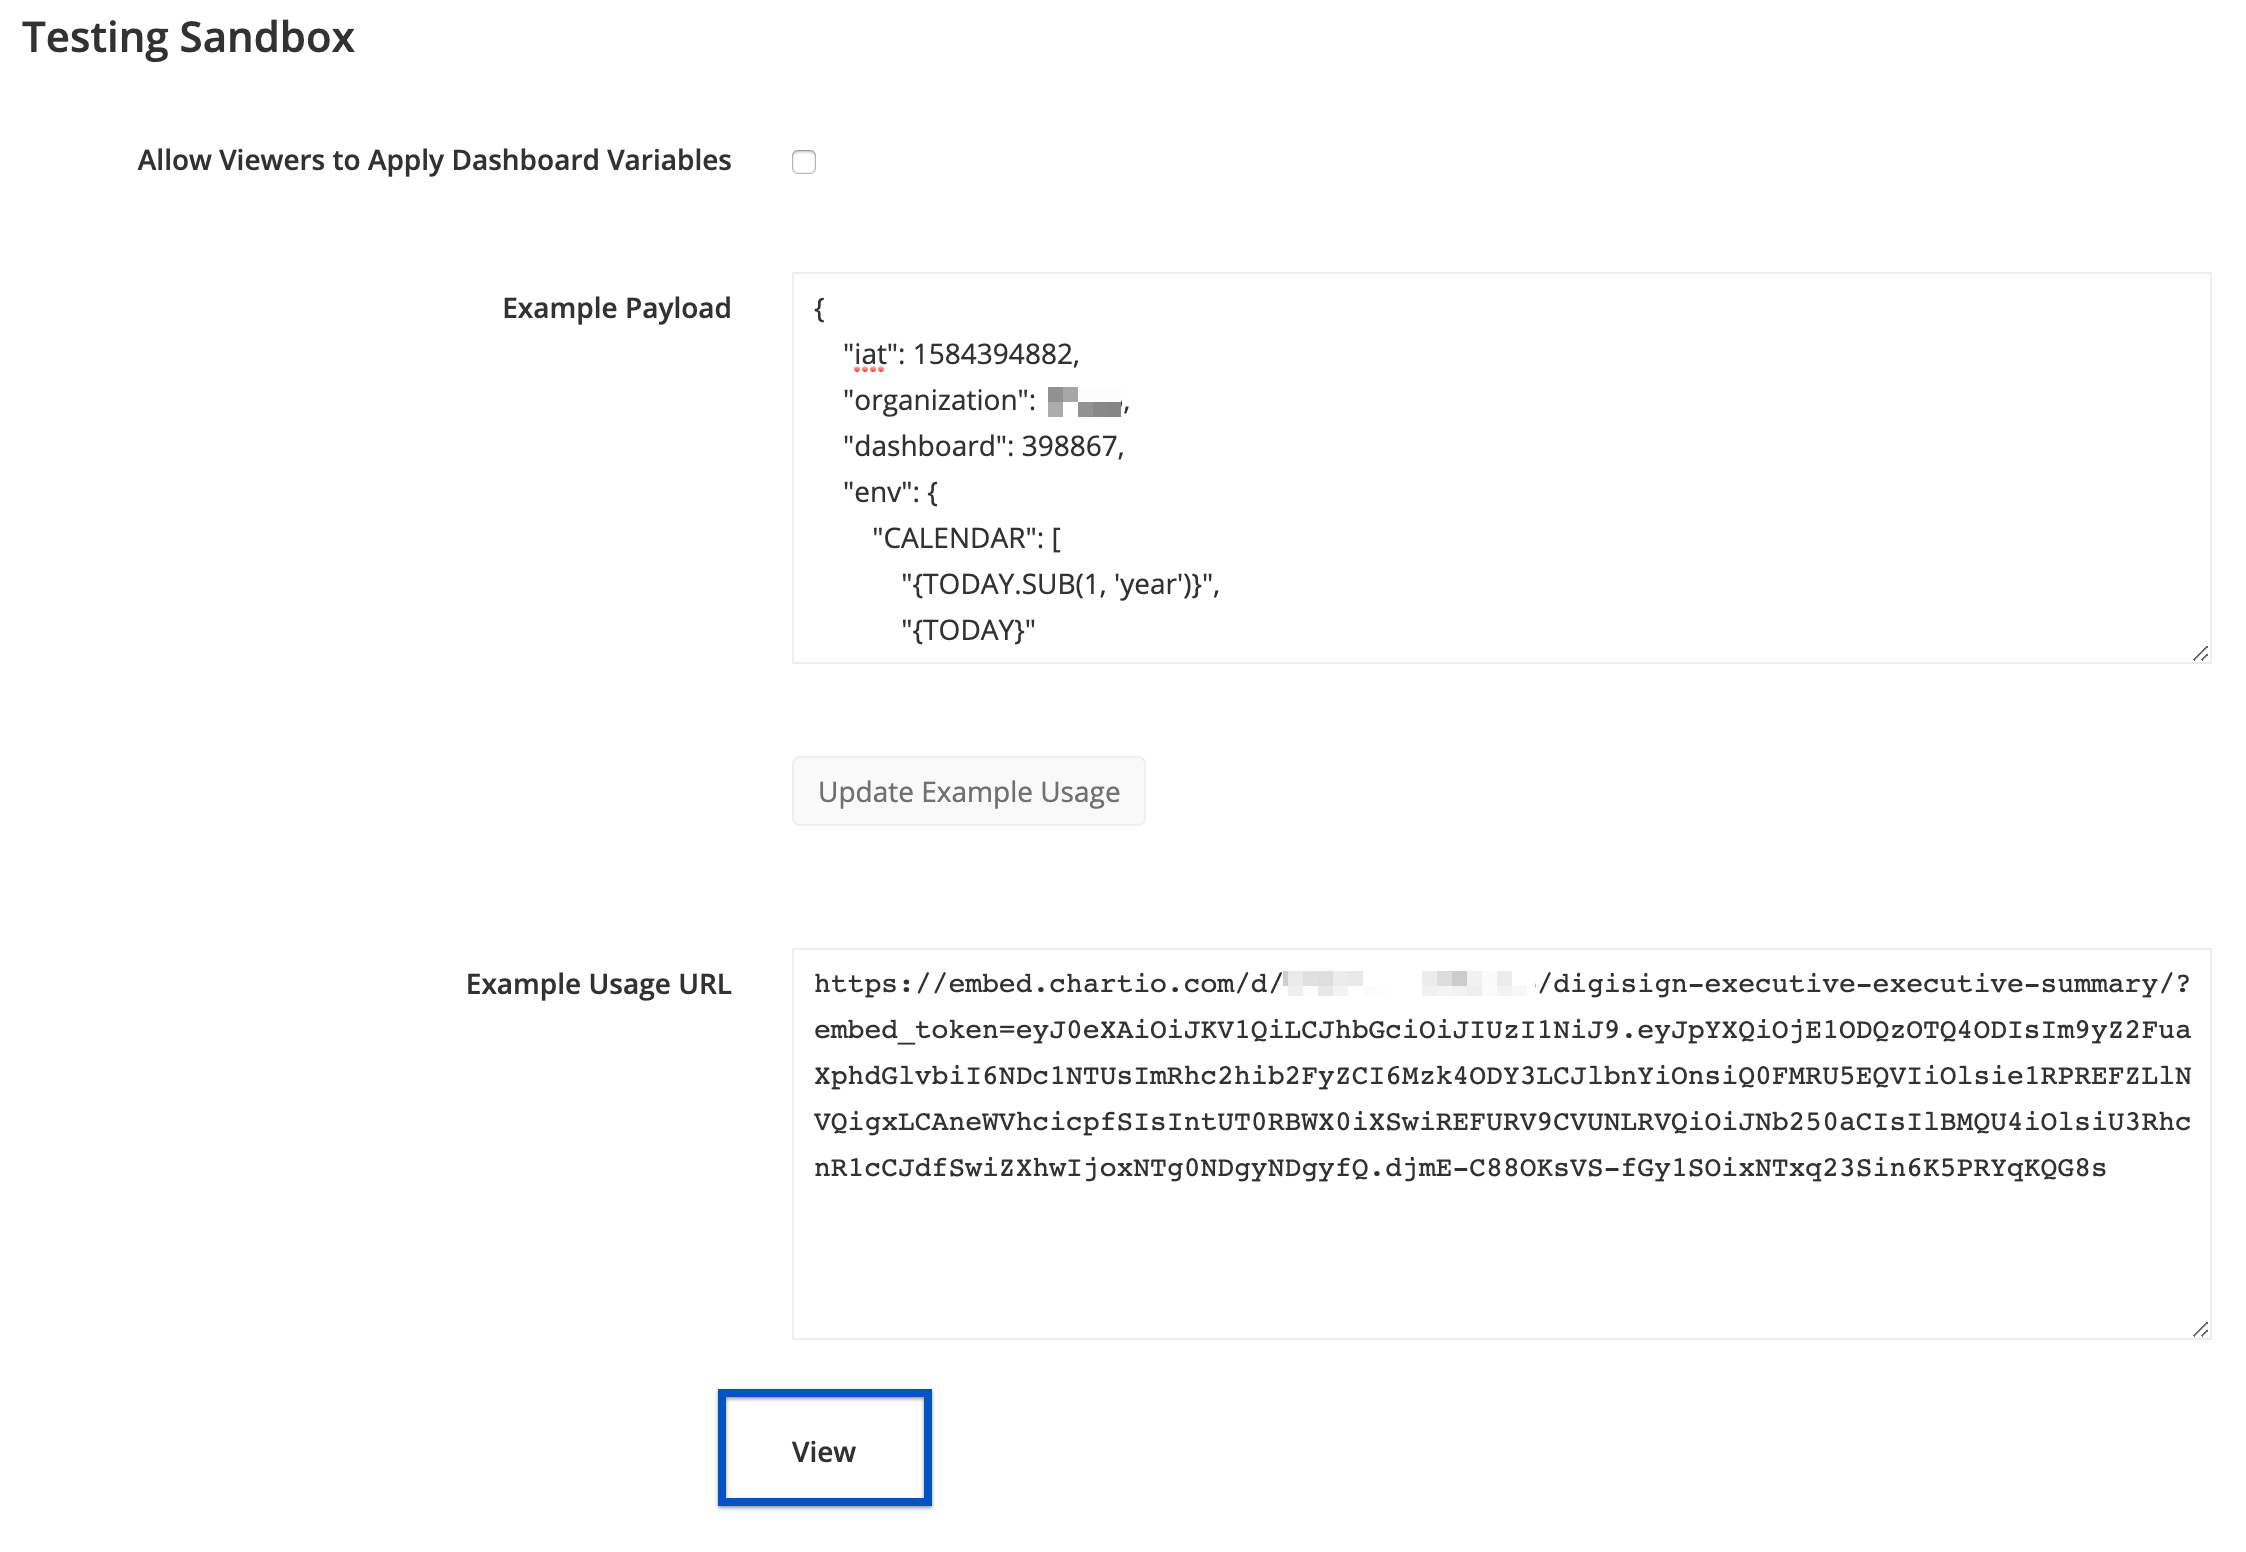
Alternatively, you can click View at the bottom of the Testing Sandbox to see the default view of your embedded dashboard; the dashboard shown is the same as how it would look when you first open the dashboard in Chartio.

5. Wrap the payload in a JWT
Generate a JWT with the payload as the body using your organization’s Embed Secret (see Step 2) and the HMAC256 signature mechanism.
Example Python payload:
ORGANIZATION_SECRET = 'YOUR SECRET HERE'
token = jwt.encode(payload, ORGANIZATION_SECRET)
6. Submit the JWT in an iframe
Insert an <iframe> element into your HTML with a src URL consisting of the generated JWT appended to the base URL from the dashboard example code.
BASE_URL = 'https://embed.chartio.com/d/org-slug/dashboard-slug'
print('<iframe src="%s/?embed_token=%s"></iframe>' % (BASE_URL, token.decode('utf-8')))
Please note the required format for the src URL, replacing {BASE_URL} and {JWT} with the base URL and JWT token from Step 5, respectively:
{BASE_URL}/?embed_token={JWT}
7. Test the Results
Test the results by requesting the application page containing the embedded <iframe>. The dashboard’s charts are incrementally loaded each time an embedding request includes a brand new JWT. The dashboard will be cached on Chartio’s servers for all subsequent requests until the JWT expires.
Note: If you’re having trouble viewing an embedded dashboard, you may need to enable third-party cookies.

If the dashboards aren’t loading as fast as you’d like, take a look at our documentation on optimizing embedding loading times.