Join data across databases
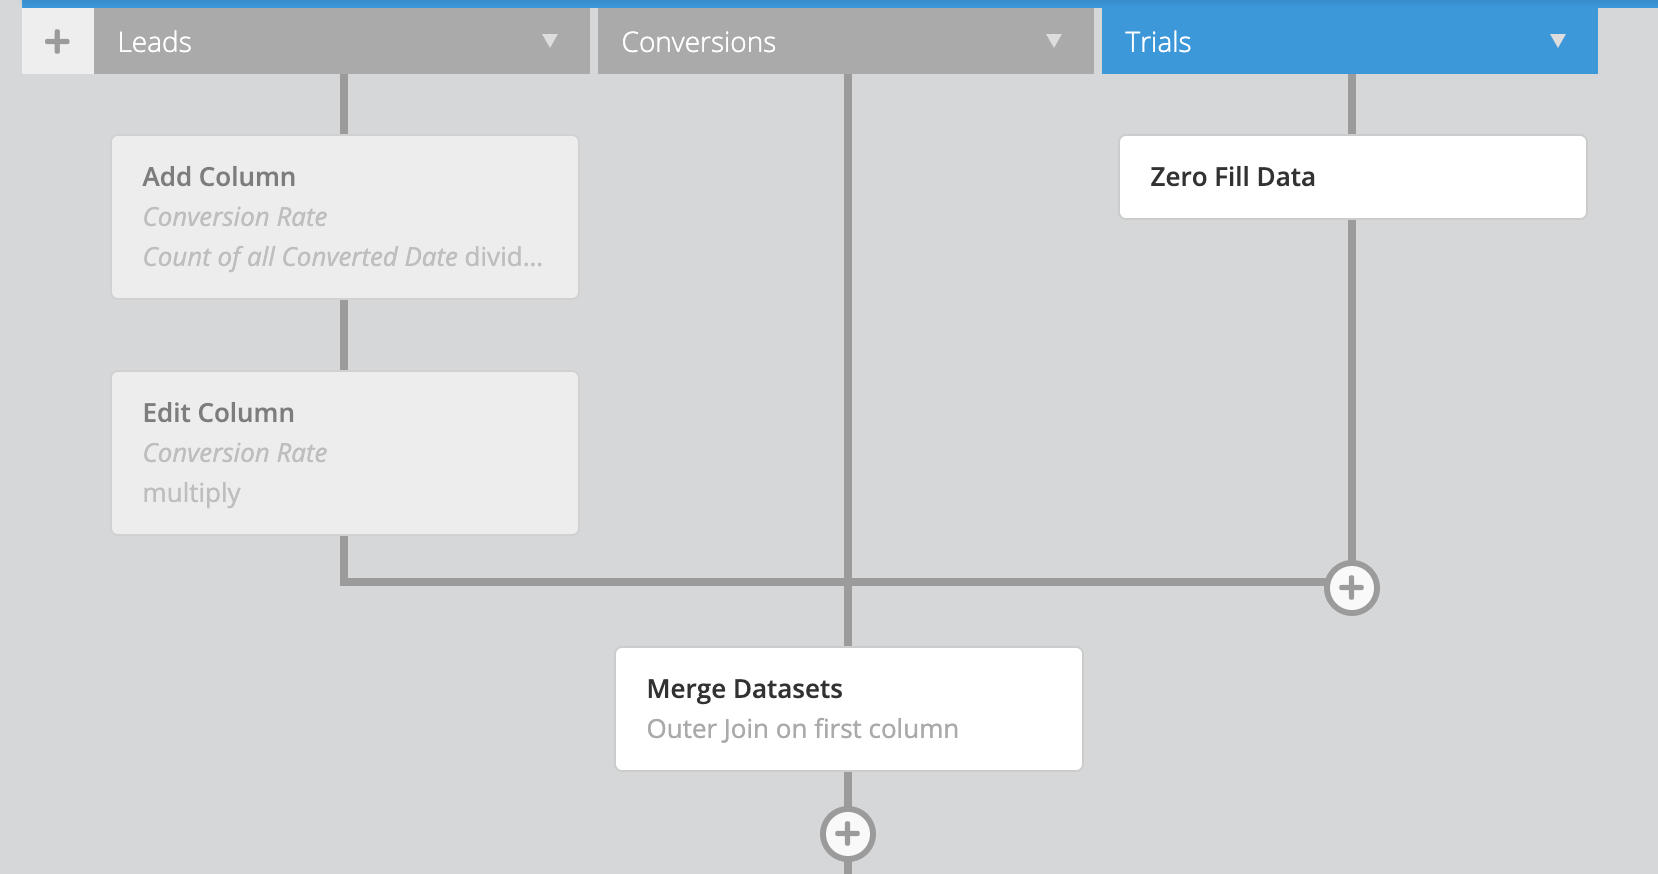
There may be instances where you want to query data from multiple data sources to generate your chart. Chartio allows you to join across databases using Datasets. Each Dataset is one query from a data source, and you can merge your Datasets using a join.

When adding two or more Datasets in the Data Explorer, you will need to select a method for merging, or blending, the Datasets. For every join option except Union and Cross Join, you can choose how many columns you would like to join the Datasets on.
If you would like to reuse the query results from merging your two or more data sources, you can do so by creating a Data Store. You will be able to use this as the Data Source in your charts without the need for additional Datasets.
You can find additional information in our documentation on merging Datasets in Chartio.
Also if you’re curious, we’ve got a nice visual explanation of joins and join types on dataschool.com.
Joining Datasets on multiple columns
You can join your Datasets on more than one column if you have multiple common fields.
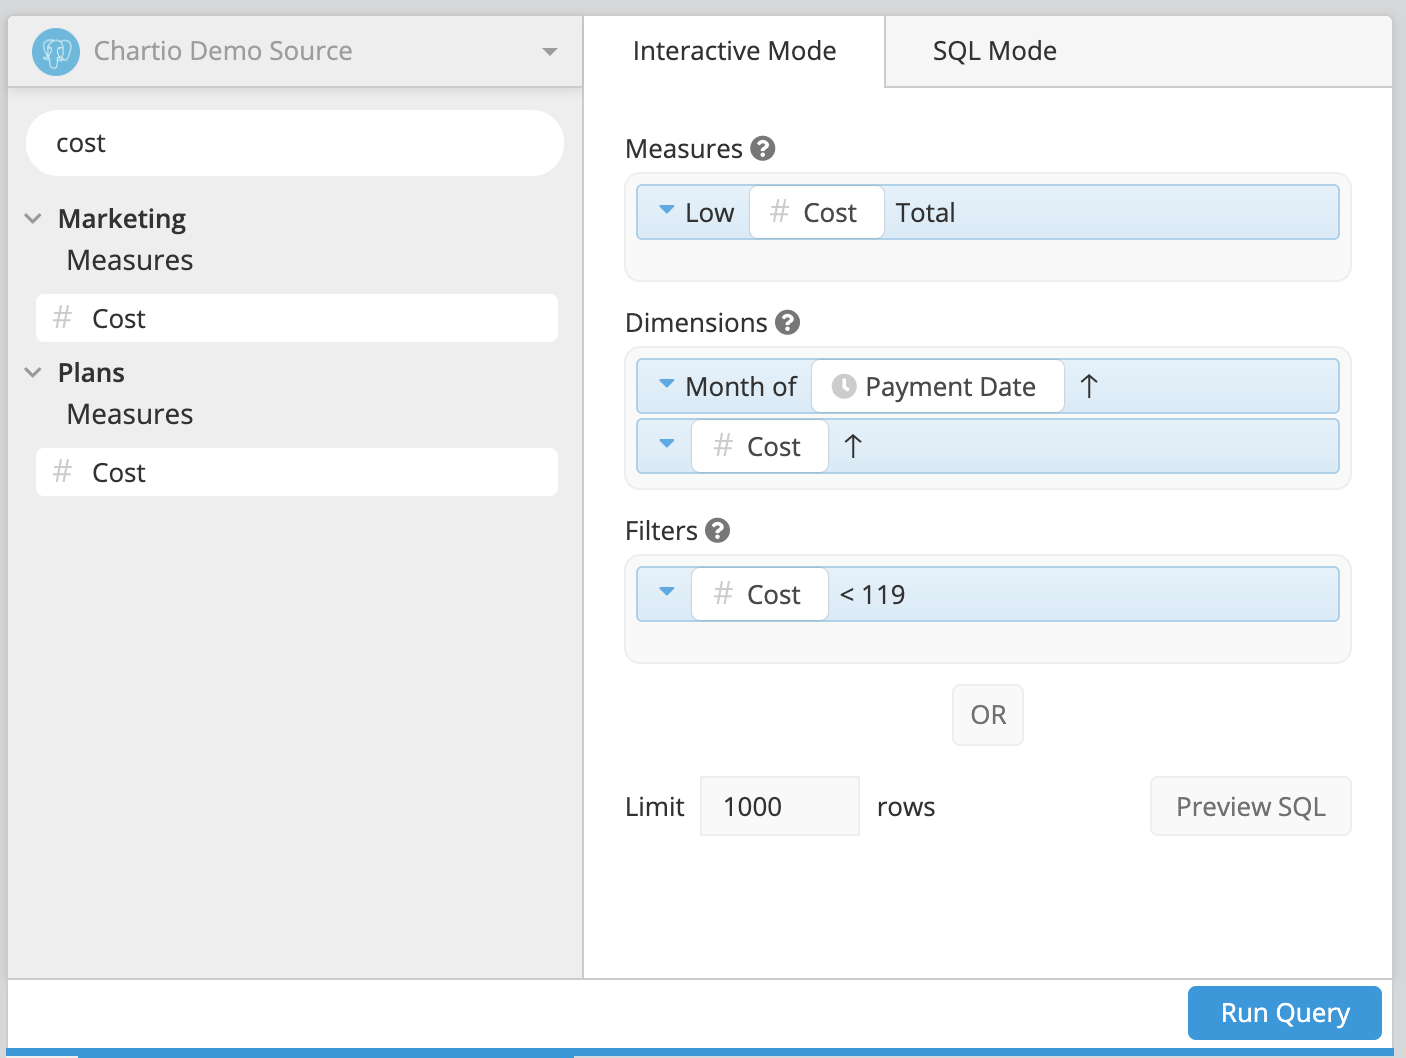
In the example below, we want to group our Payments by Date and then by Plan Cost. We want to separate our plans into two Datasets: Low Cost and High Cost, which we’ll accomplish by filtering the datasets by the Cost column. Here’s what our first dataset looks like:

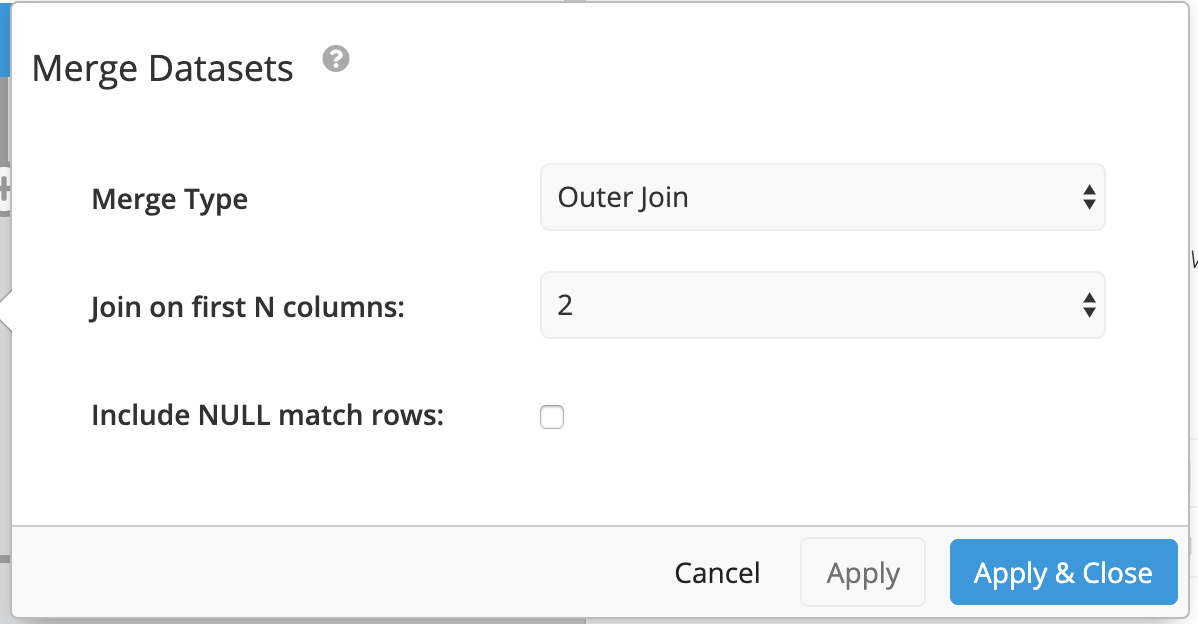
We’ll then need to join our Datasets on the first two columns. To do this, click on the Merge Datasets Pipeline Step, select Outer Join as the merge type, and select 2 from the Join on first N columns dropdown. This allows us to join our Datasets on both the Month of Payment Date and Cost columns. Click Apply & Close when done.

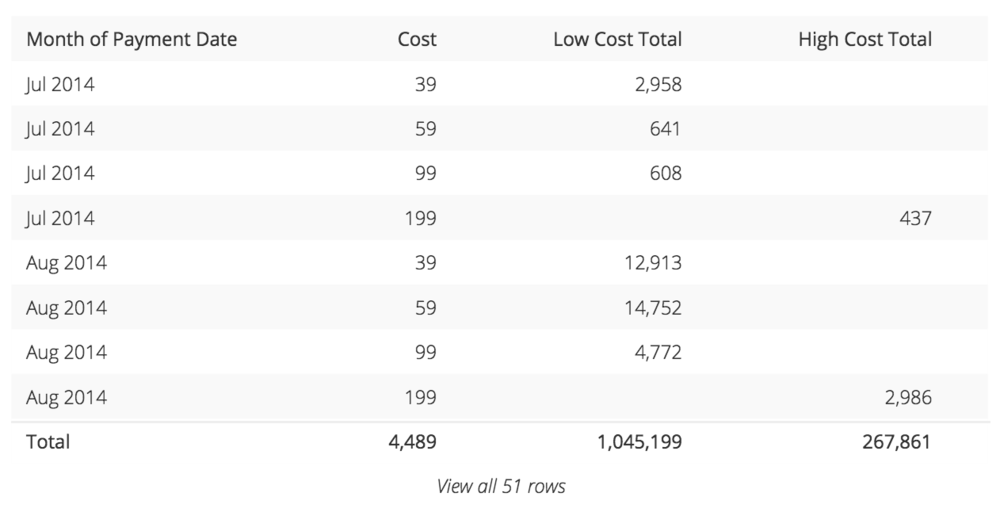
We’ll also check the Show row totals for numeric columns option in the Chart Settings so we can compare the Low and High cost totals. Here’s what our final chart looks like:

For more details on joining Datasets, please see our documentation on Merging Data.