Manage Data Sources
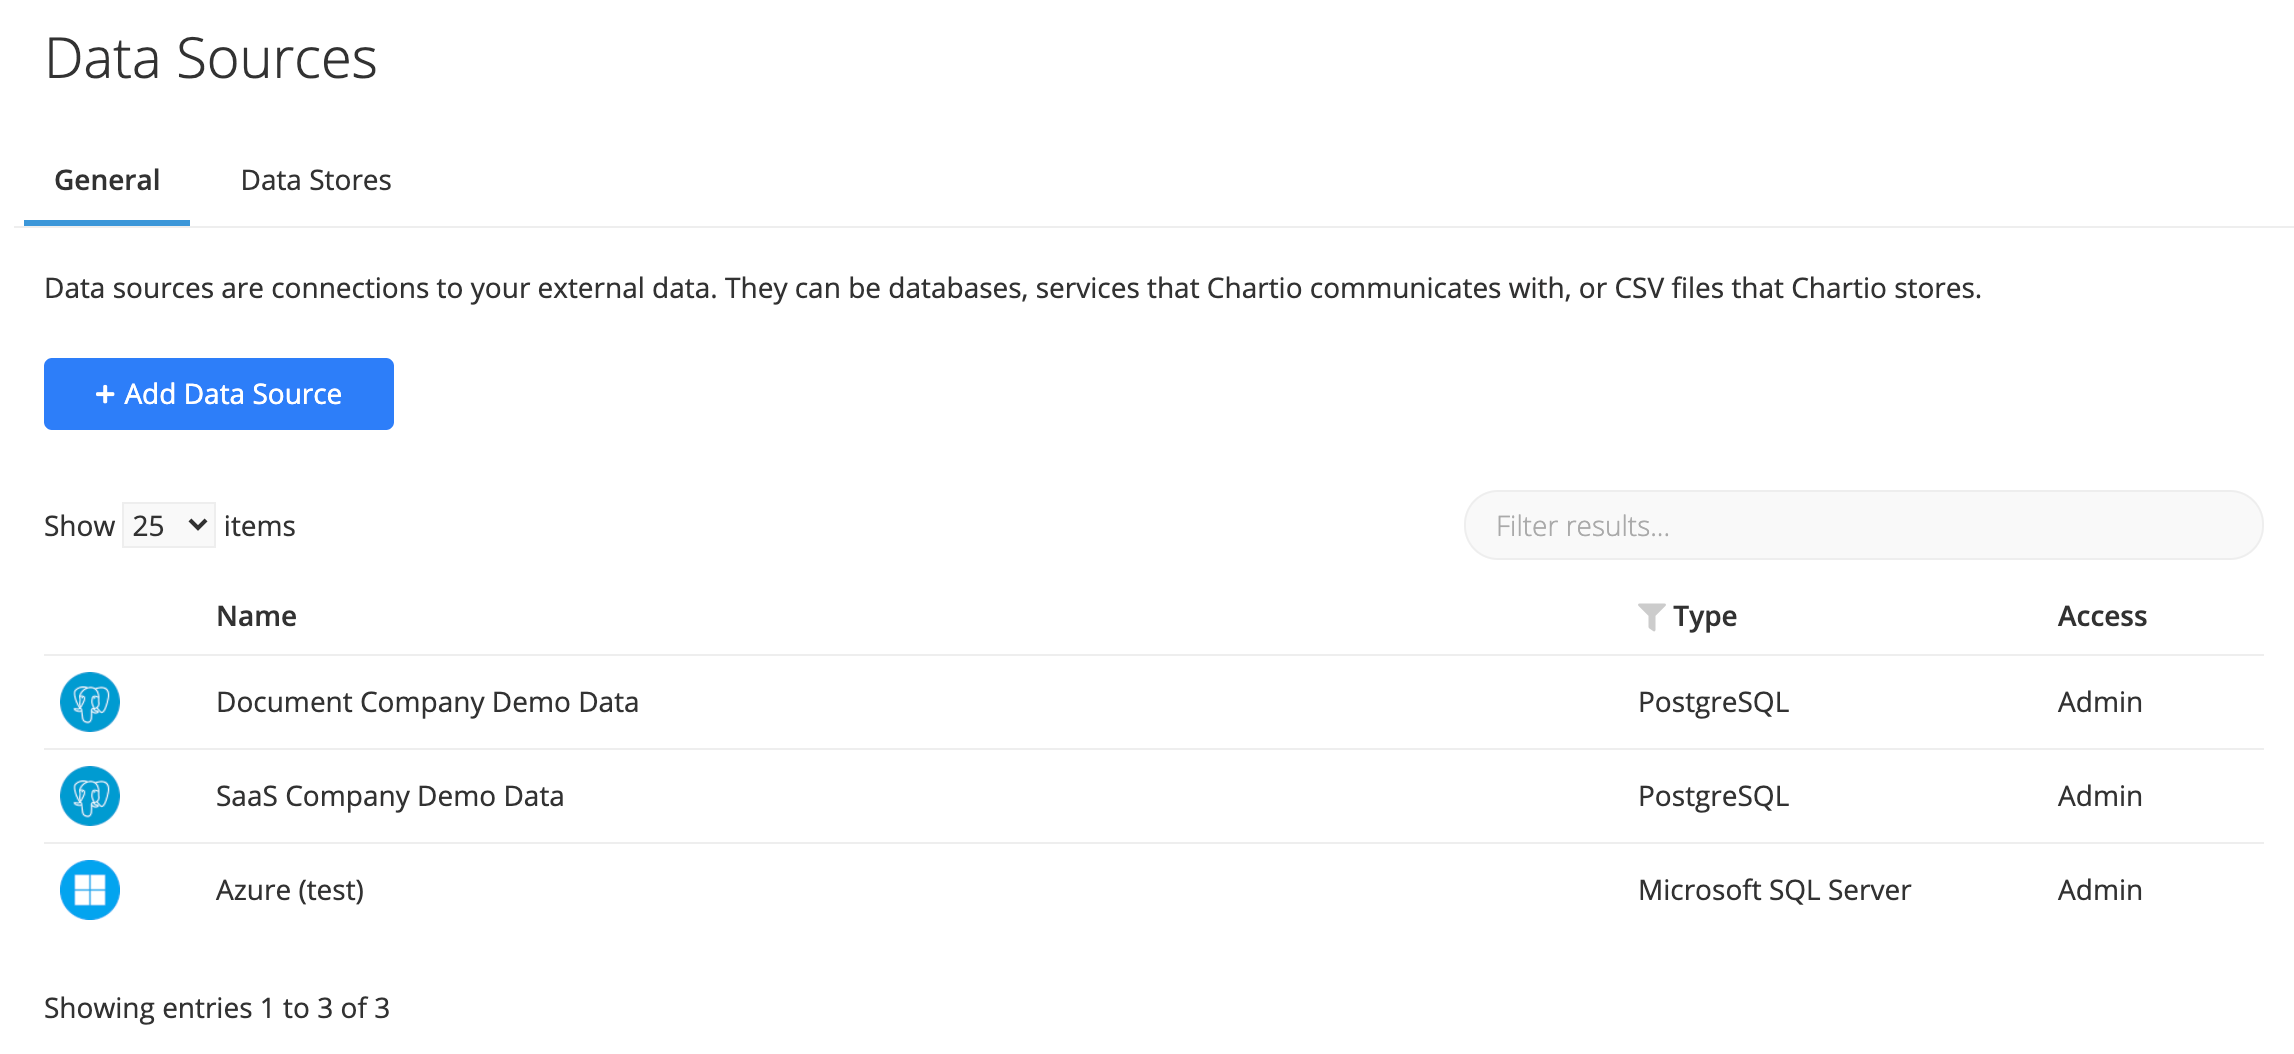
Once your database or data warehouse has been connected to Chartio, you can manage or move the connection and track connection or query errors directly from the Data Sources page. This section highlights how to do this along with ways to customize how your data can be queried within Chartio.
| General | Access | Connection | Debug |
| Schema | Query log | Stats | Activity |
| Queries | Change History |
Need to delete a data source? Make sure to first check out everything you need to know about disconnecting a data source below.
General settings
Data source alias
You can rename an existing data source and update how it’s displayed for users in your account.
From the Data Sources page, click on the data source you’d like to update. Under the General tab, simply update the Data Source Alias to the new name and click Save.
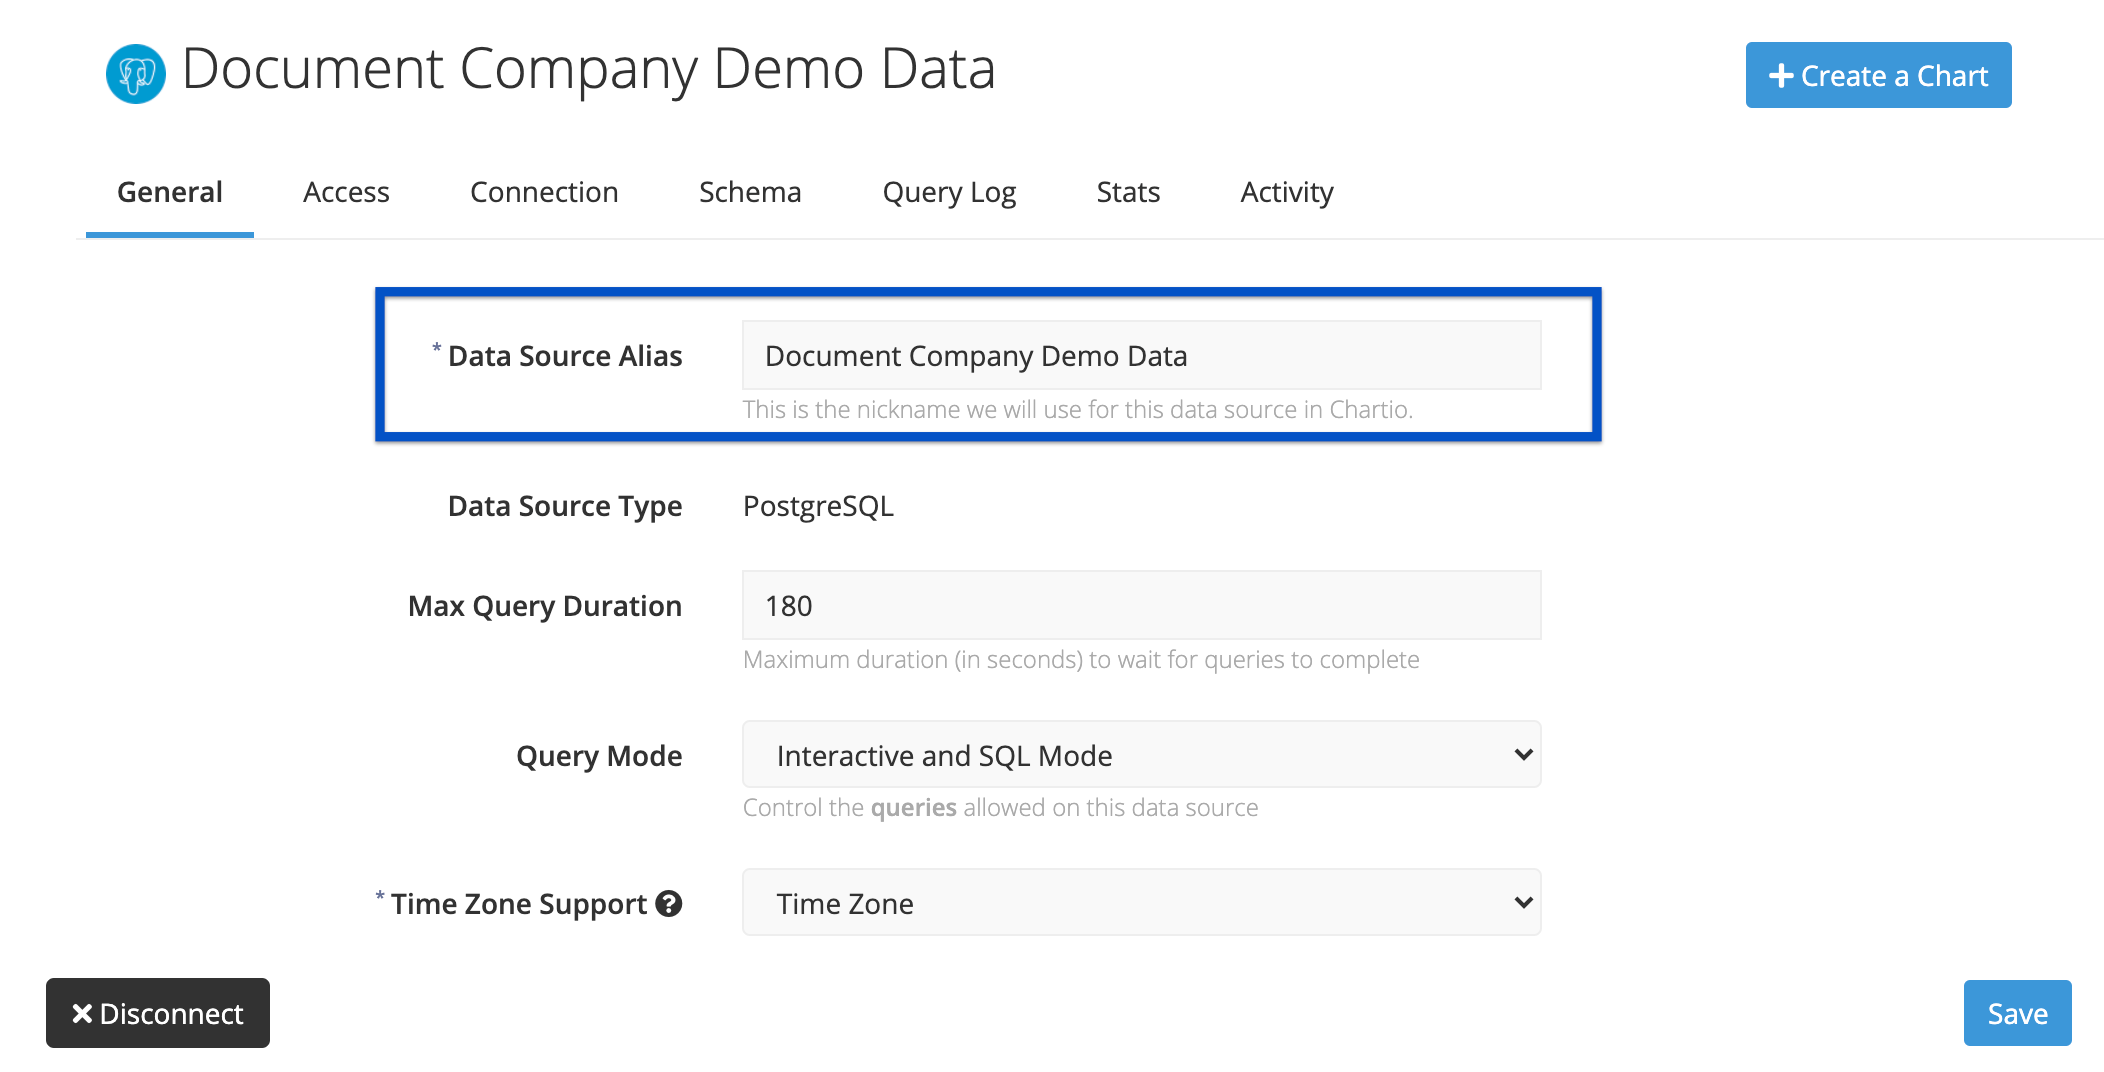
Any charts using this data source will now display the new alias. Users in your account will now also see this name for the data source throughout the platform. And don’t worry—none of your charts will break if you change the data source alias.
Max query duration
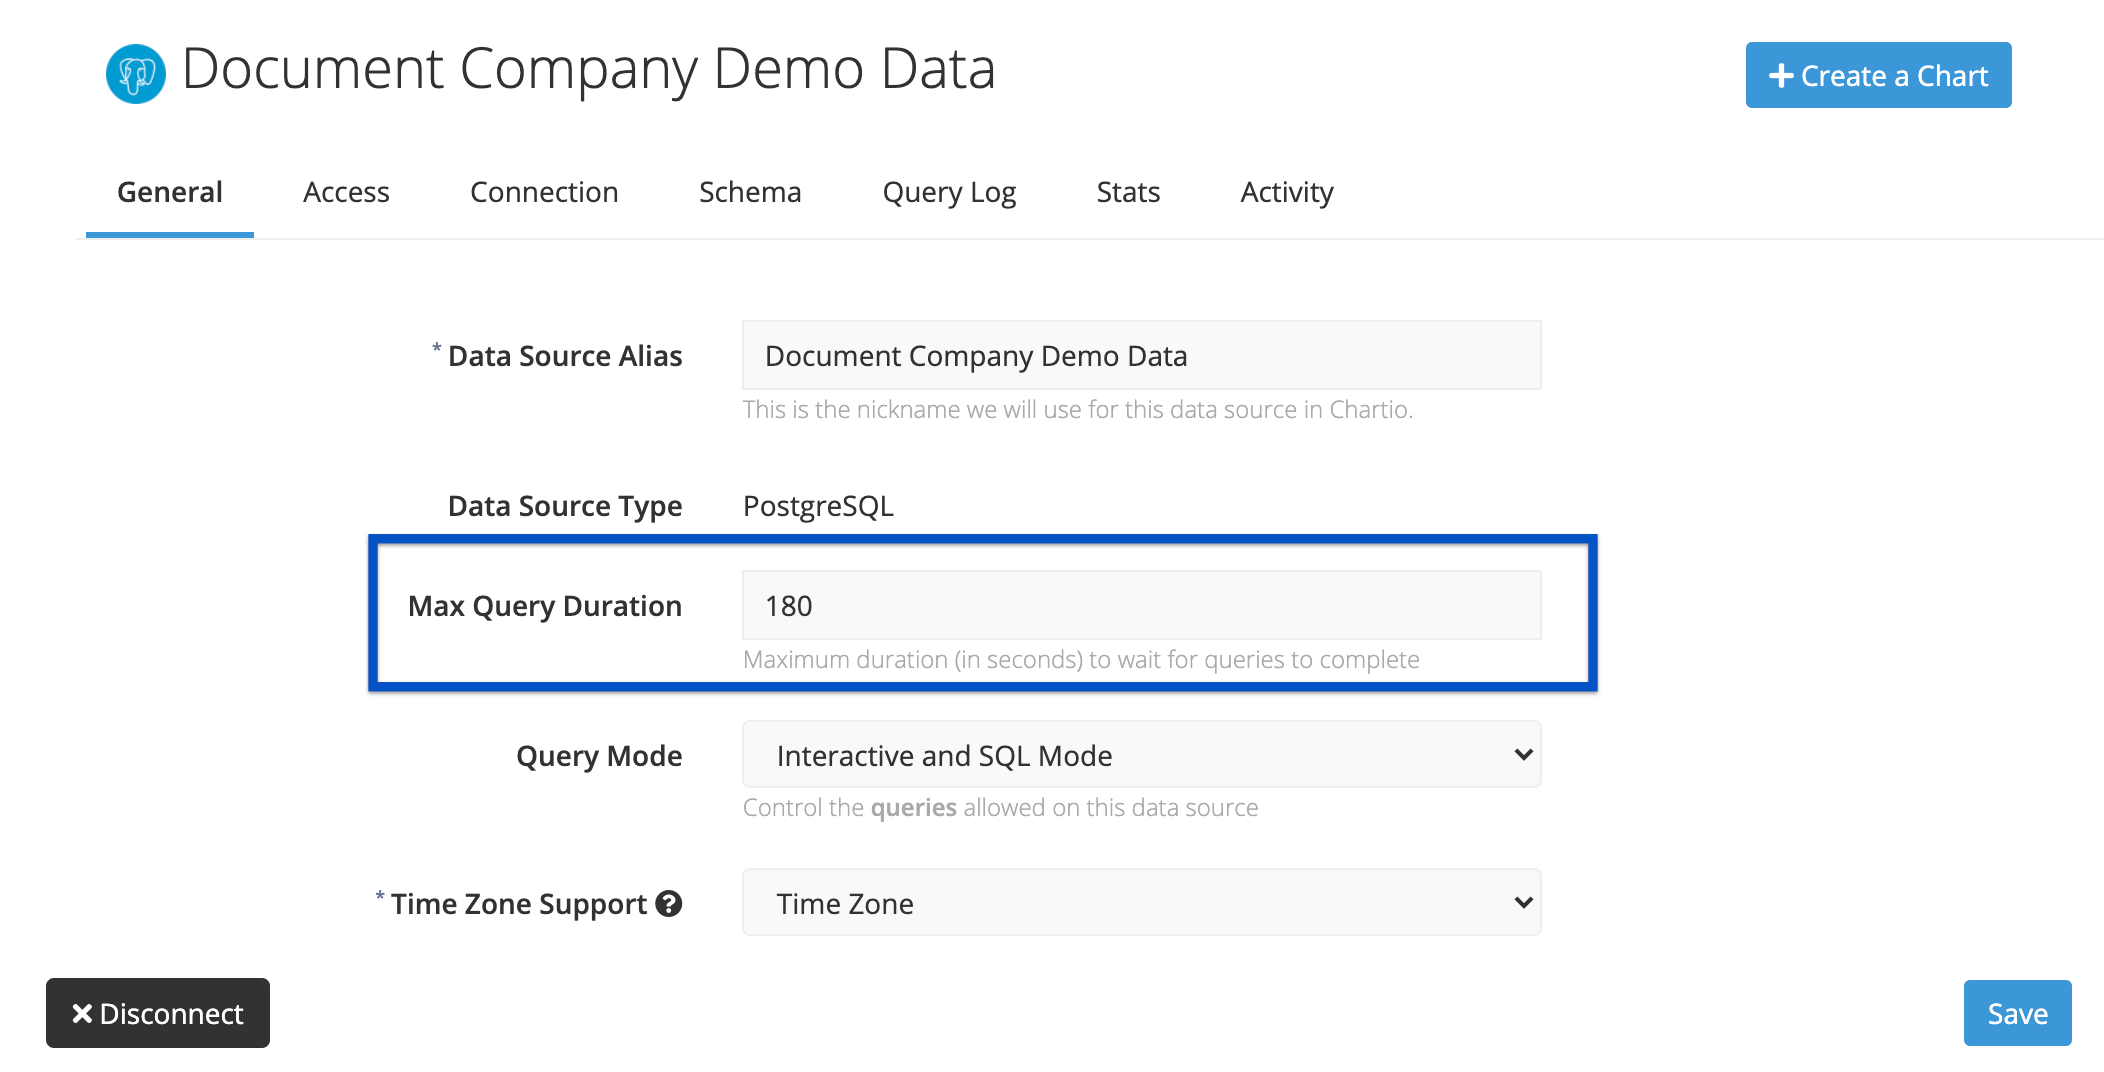
Chartio allows you to set a Maximum Query Duration for your data source, up to 300 seconds. Any queries that take longer than the amount of time specified will be canceled. Set this to a low value to prevent long-running queries from tying up resources on your database server and slowing down other queries.
300 seconds is a hard limit and can’t be adjusted. However, you do have the option to turn your query into a Data Store, which allows you to set a max query duration of 30 minutes!
Hide new tables
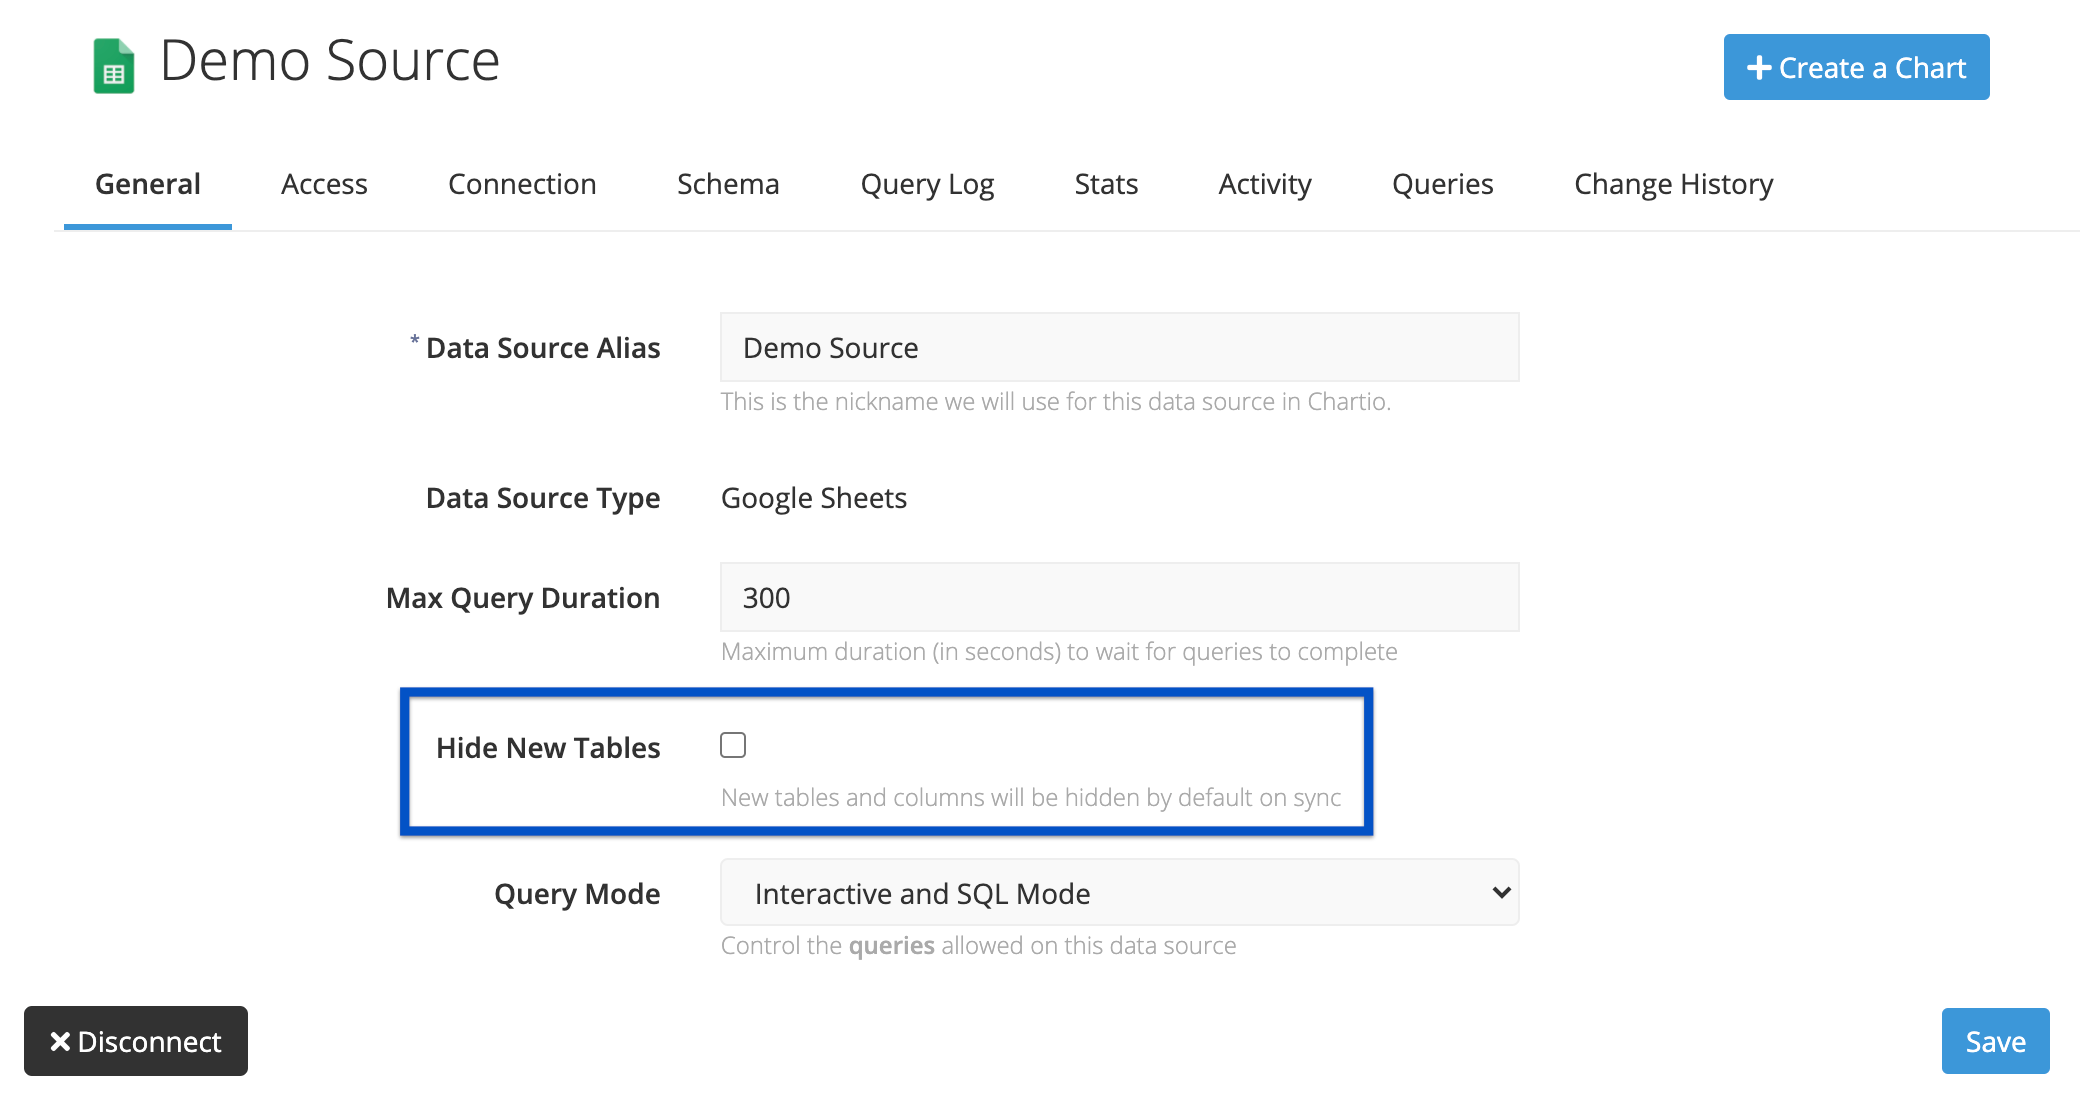
When you sync your schemas in Chartio, all tables and columns are brought in and visible by default. Enable the Hide New Tables setting if you’d like new tables and columns to be hidden by default. Remember to click Save to apply the change.
Query mode
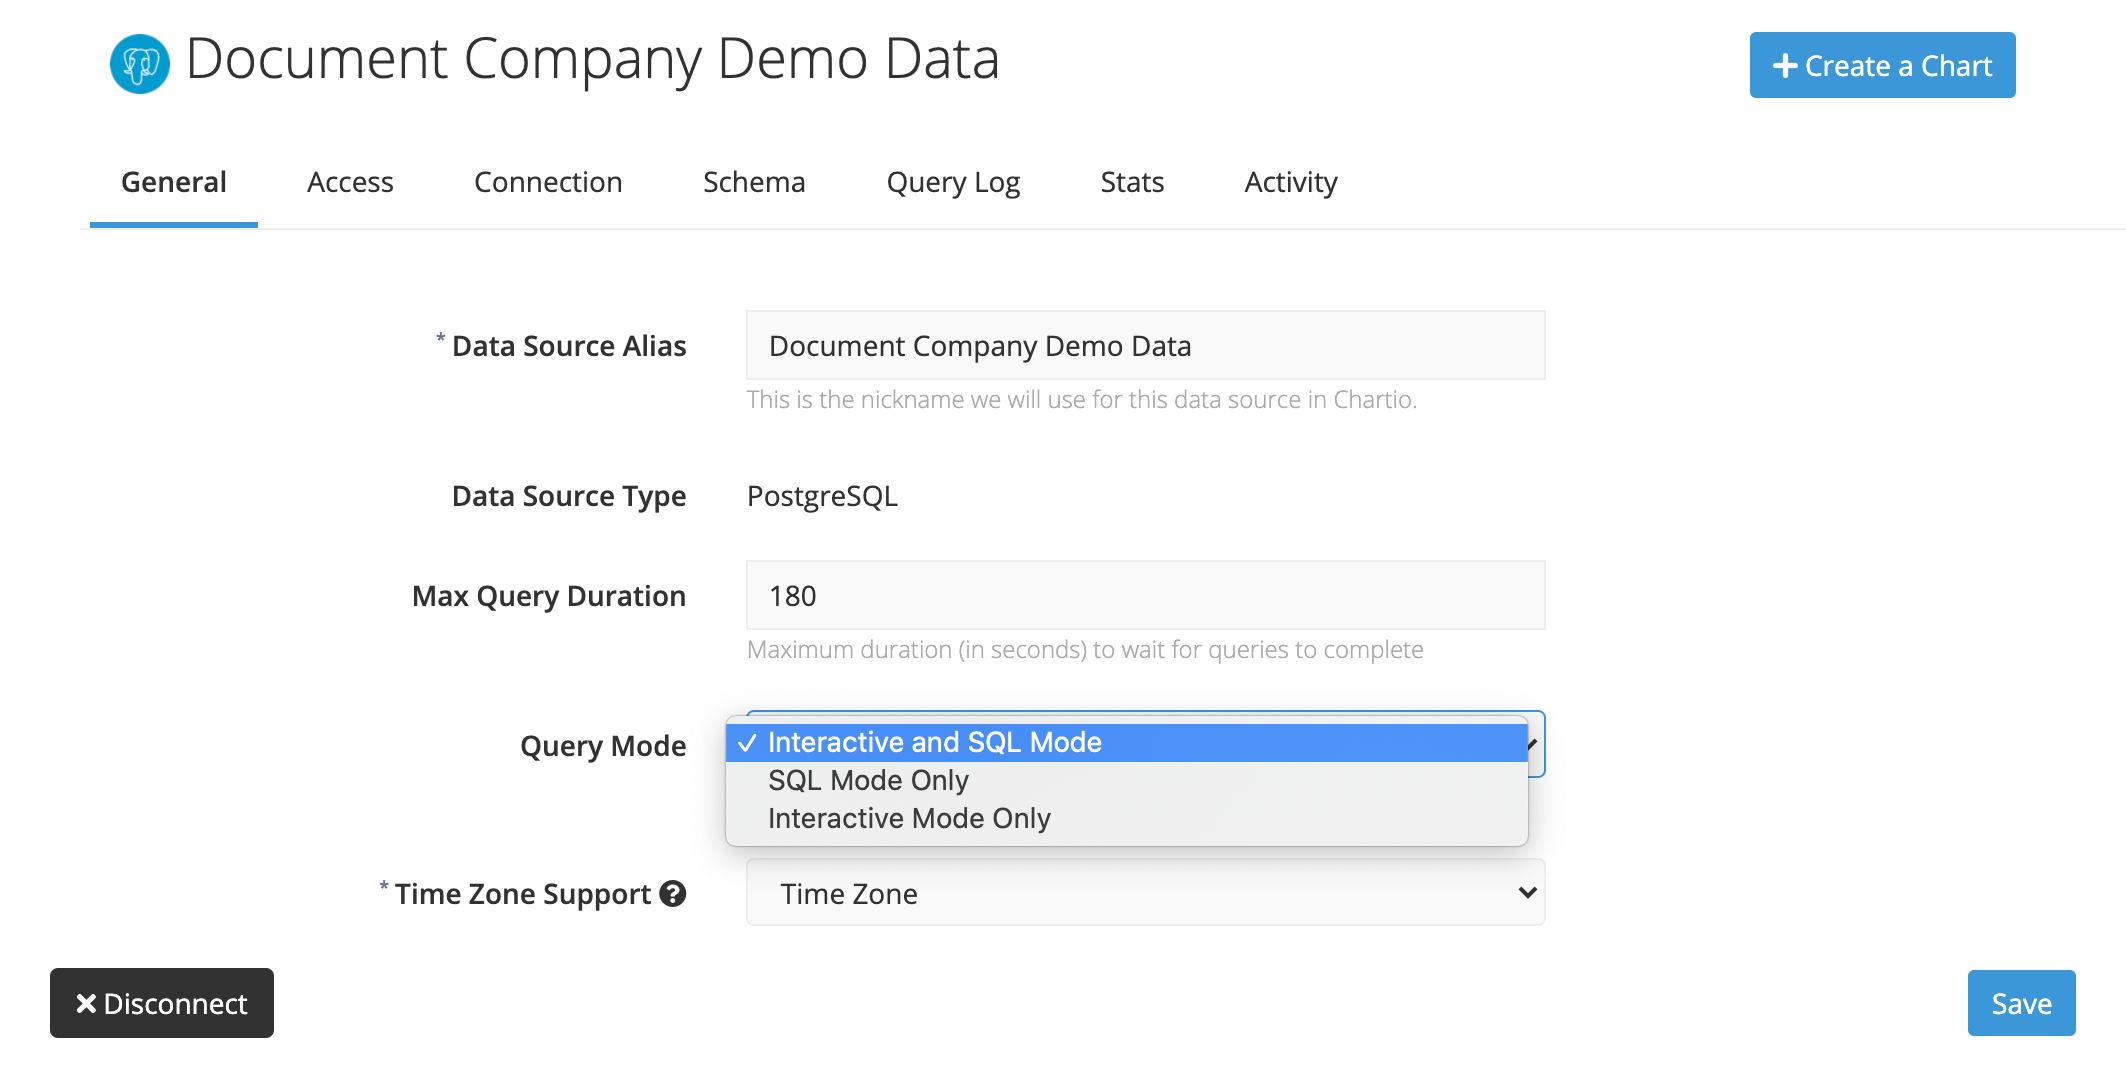
It is possible to restrict the query mode (Interactive vs. SQL) used to query specific data sources in Chartio. The default in Chartio is that either mode is available to your editors. This default can be adjusted for each of your data sources. For existing data sources, any charts previously created in the disallowed mode will be viewable but not editable.
You can make this change on any of the data sources in your organization. You must be an Owner of your Chartio account or Admin of the data source to update the default.
From the Data Sources page, select the data source you’d like to restrict. In the General tab, you can then adjust the Query Mode as appropriate. Once you’ve made the change, click Save and you’ll be good to go!
Time Zone Support
You can set the Time Zone Support for each data source added to your organization. For detailed Time Zone information, view our Time Zone Support documentation and how data source time zones work.
Usage
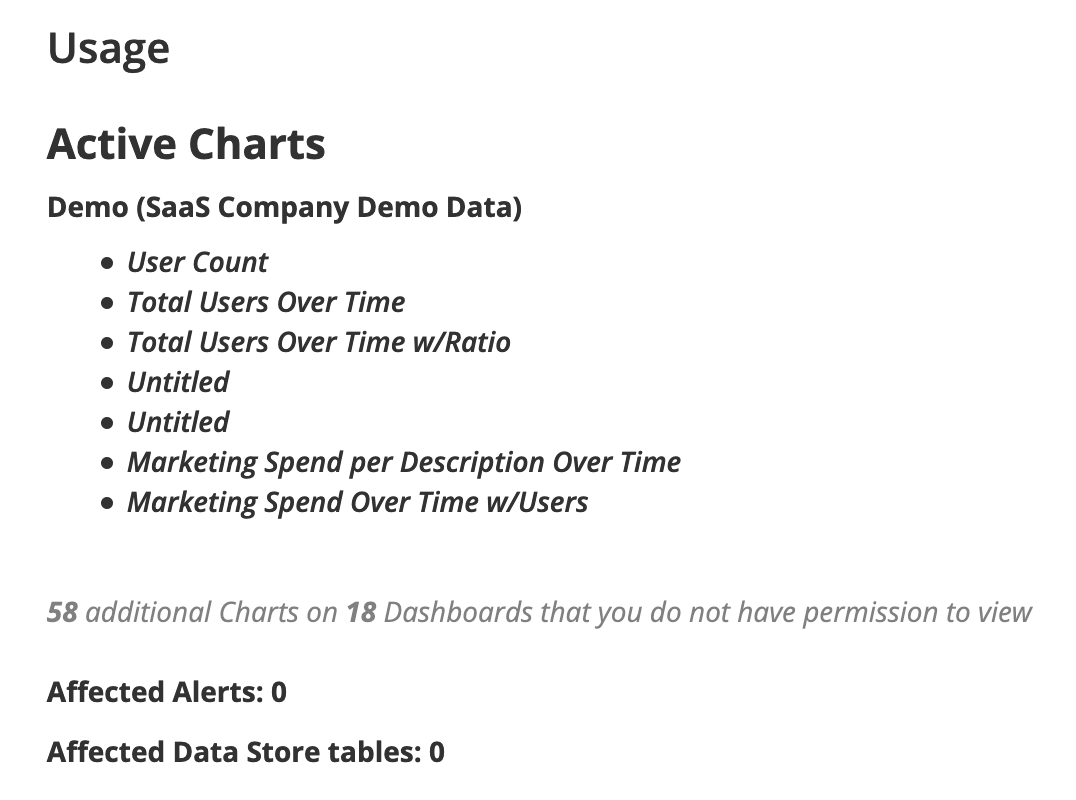
View the list of charts by dashboard (active, archived, or in trash), Alerts, and Data Store tables using the data source, but only the ones you have access to. Owners will see a comprehensive list of resources.
If you don’t have access to resources using the data source, you’ll see a message similar to the following:
X additional Charts on Y Dashboards that you do not have permission to view
You can also write into support@chartio.com and we can provide you with the full report of all charts using this data source.
Disconnect a data source
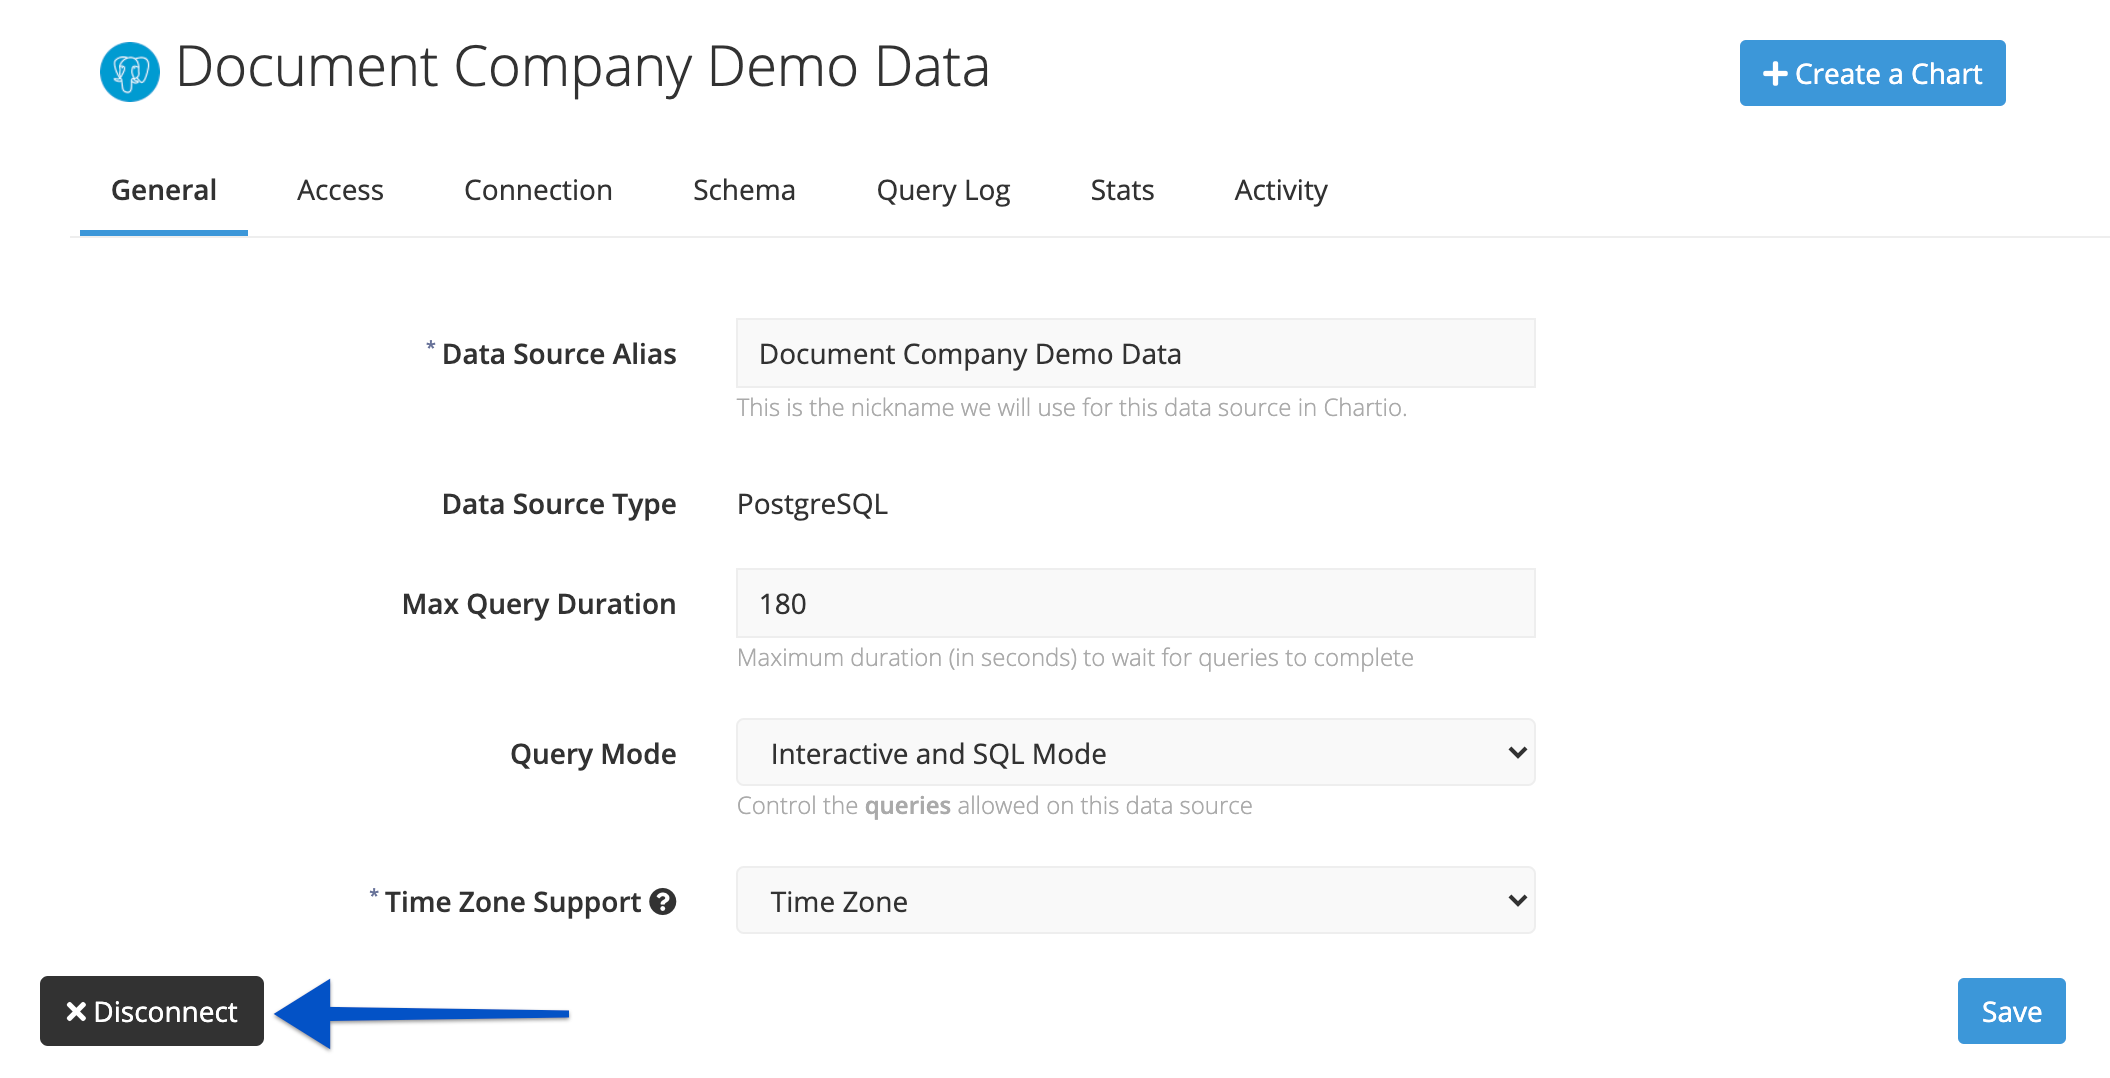
If you’d like to remove a data source from your Chartio org, click Disconnect at the bottom of either the data source’s General settings tab or Connection tab.
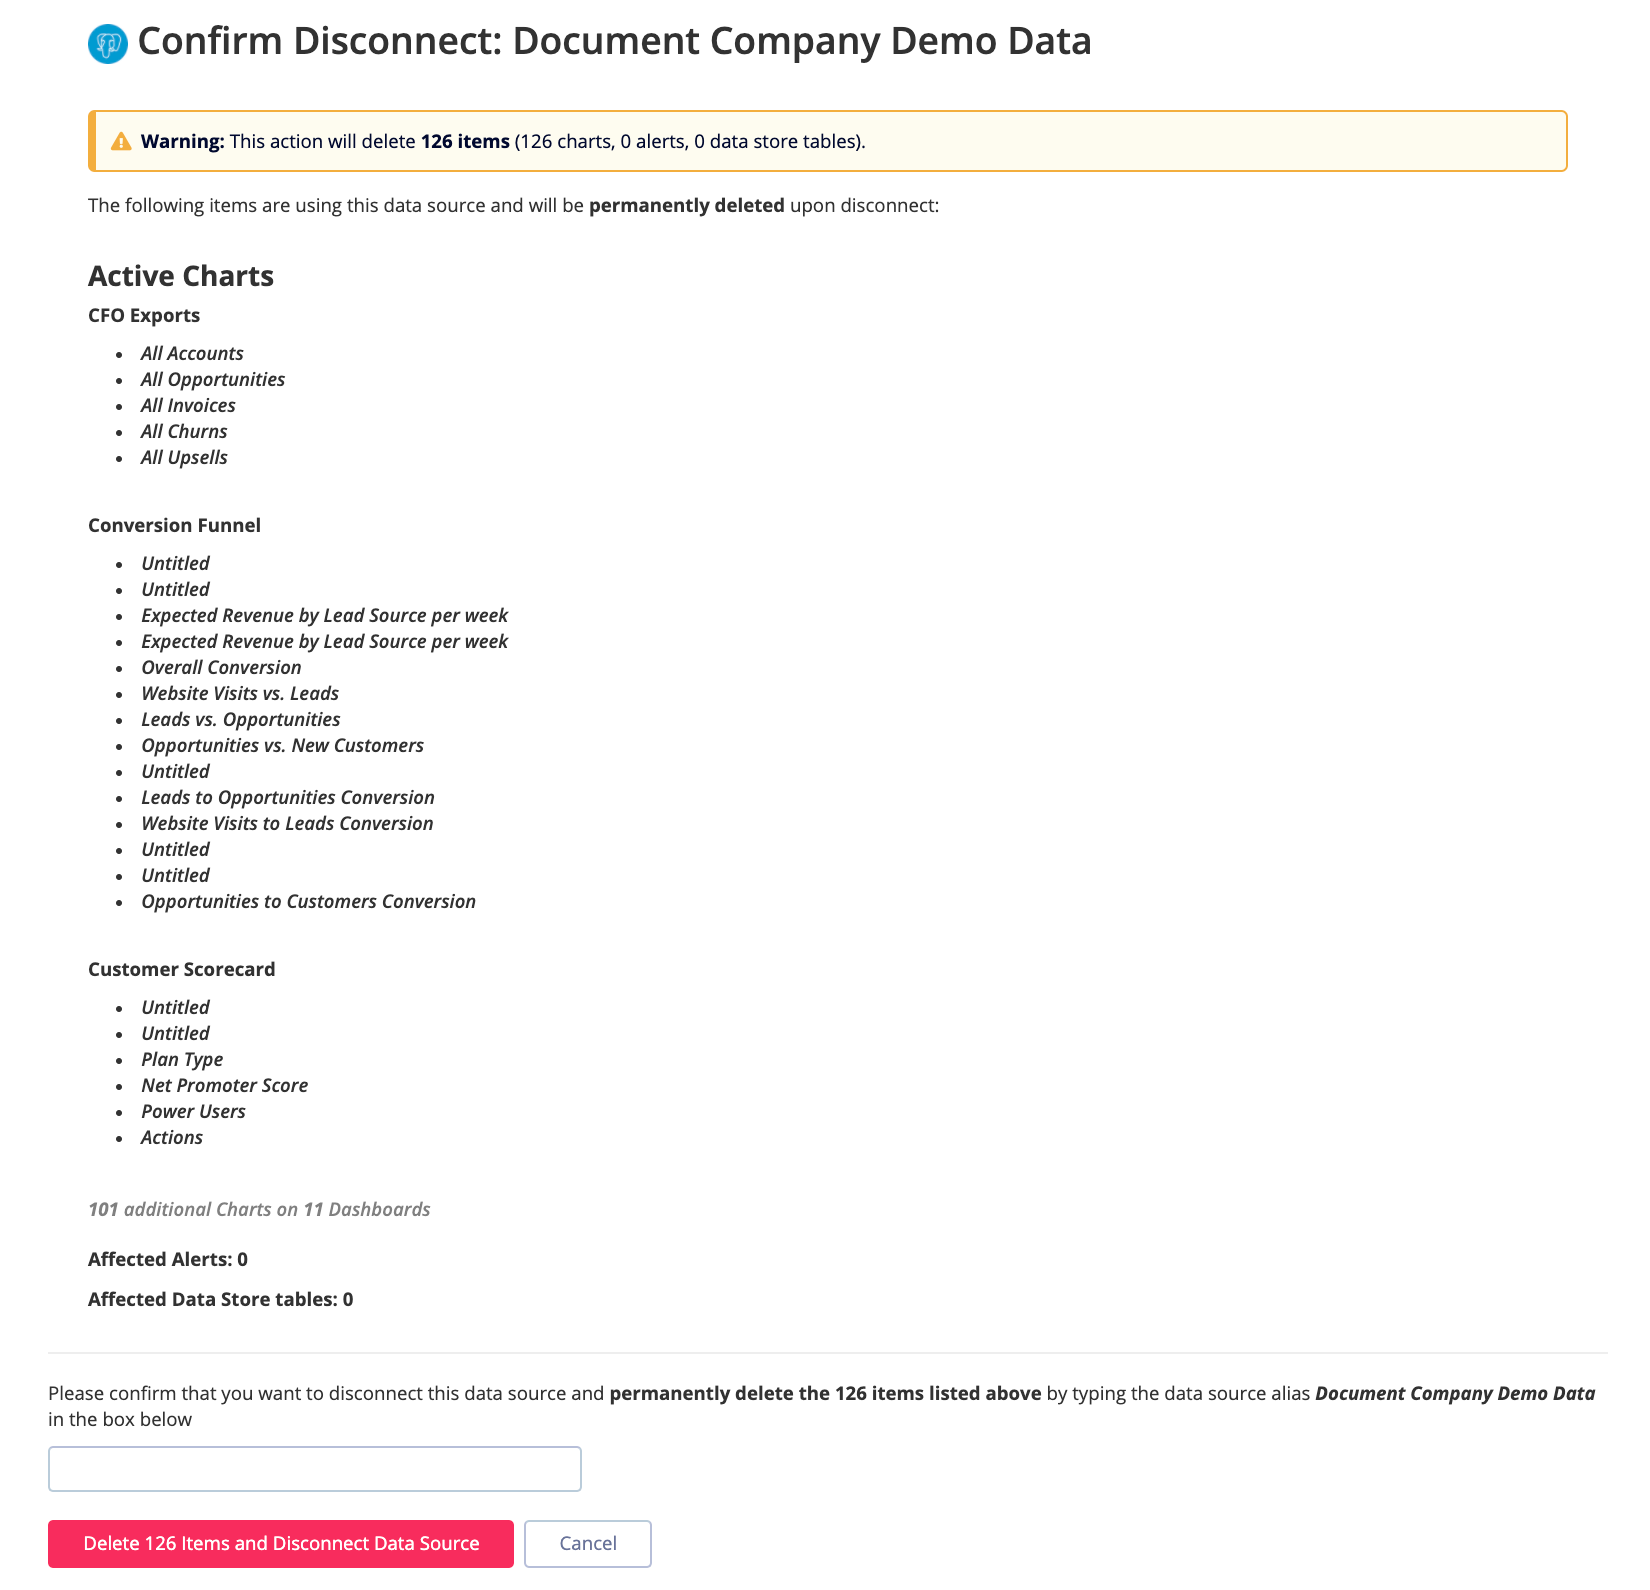
You’ll then see a list of resources using the data source—the same list that you’d see in the Usage section of the data source settings.
If you’re really sure you’d like to disconnect the data source and lose all the connected resources, type the alias of the data source in the bottom text field then click Disconnect.
Need to swap data sources for your charts? Check out our requirements and procedure for swapping data sources.
Access
Manage user access to the data source. For more details, view our data source access page.
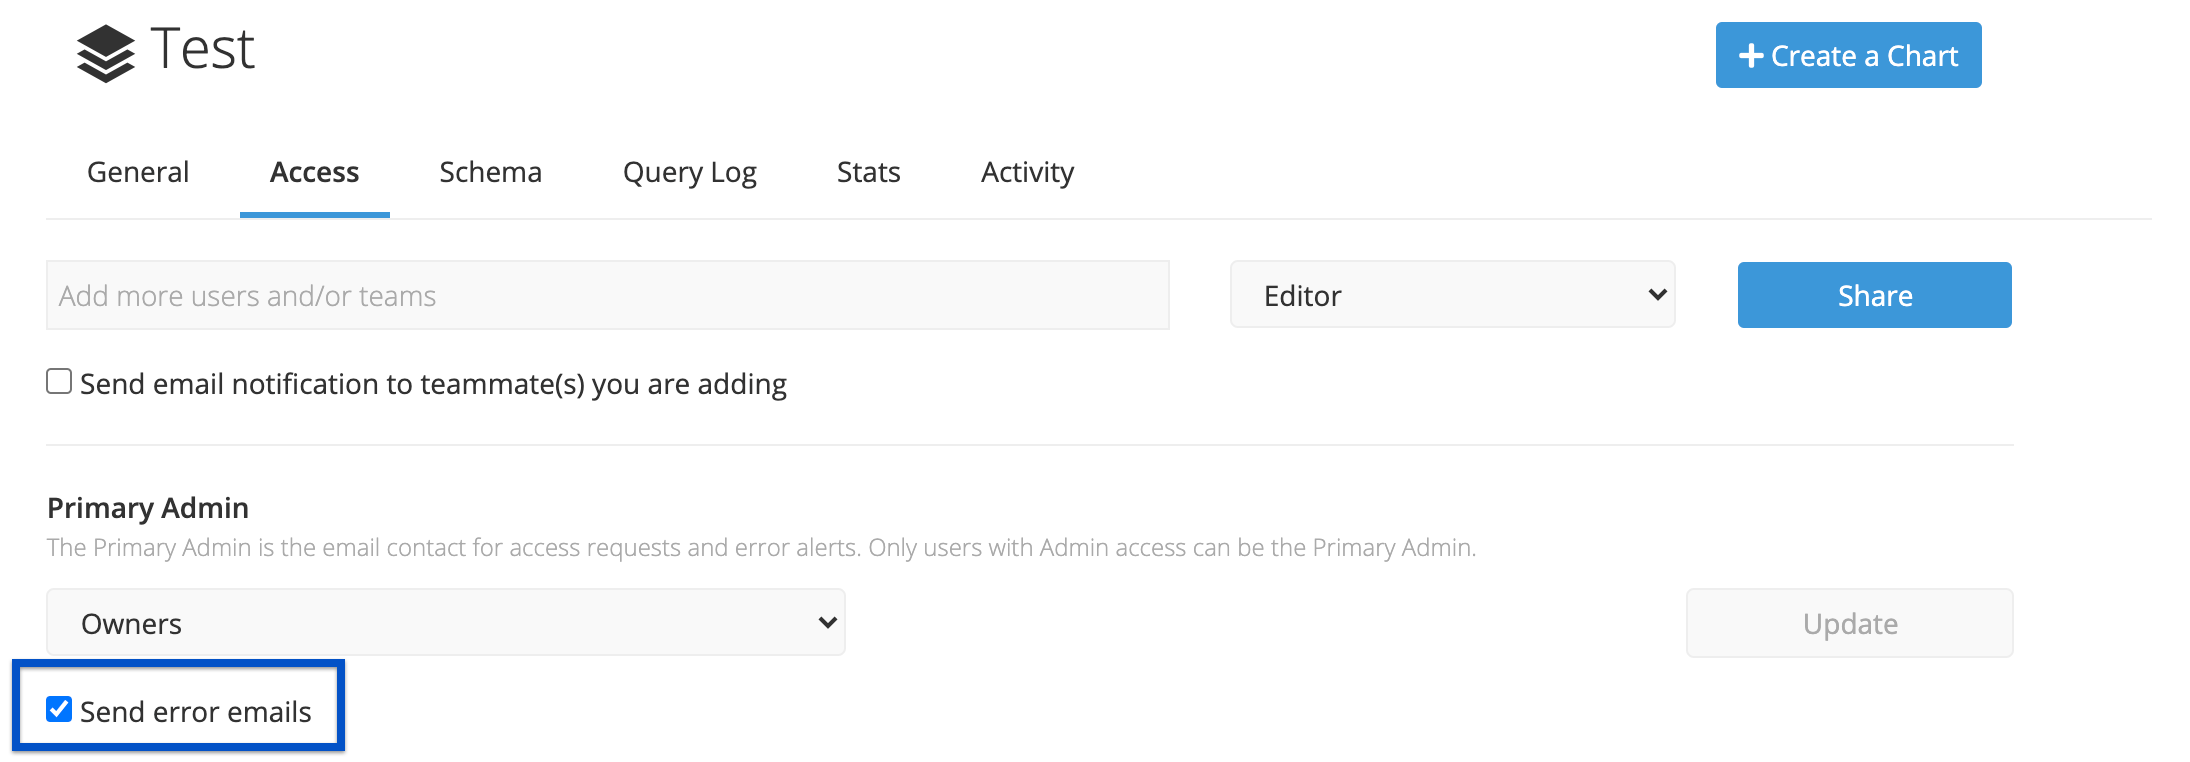
For Data Stores, the Primary Admin can opt-in to receive email notifications for stored table refresh errors by selecting the Send error emails checkbox.
Connection
View the data source login and host info. For more details, view add a new data source in Chartio.
Move your database connection
If you’ve moved your database from one server to another, you can modify the existing Connection settings for that data source in Chartio to maintain the connection—do not disconnect it. Instead, follow these steps:
- Make sure that the Chartio user has been added to your new database with the same credentials.
- Visit your data source settings (Data > your data source) and open the Connection tab.
- Enter the new hostname for your database and the current password for your Chartio user. Click Save to test the connection and save the updated connection information.
Debug
New connections
Each database has its own set of potential connection issues. Instead of documenting them all into a large tree of potential issues, Chartio has built error reporting and advice for fixing the errors directly into the setup wizard and direct connection forms, where they’re more helpful to you. If these tools aren’t enough to solve your problem, please don’t hesitate to email us at support@chartio.com.
Existing connections
If you’ve lost your connection to a previously working data source, Chartio has built a nice interface to help you debug the issue. From the Data Sources page, select your data source from the list, and switch to the Debug tab.
Chartio will run a series of tests on the different aspects of the connection that could go wrong. If your connection is healthy, the interface should look like the following:
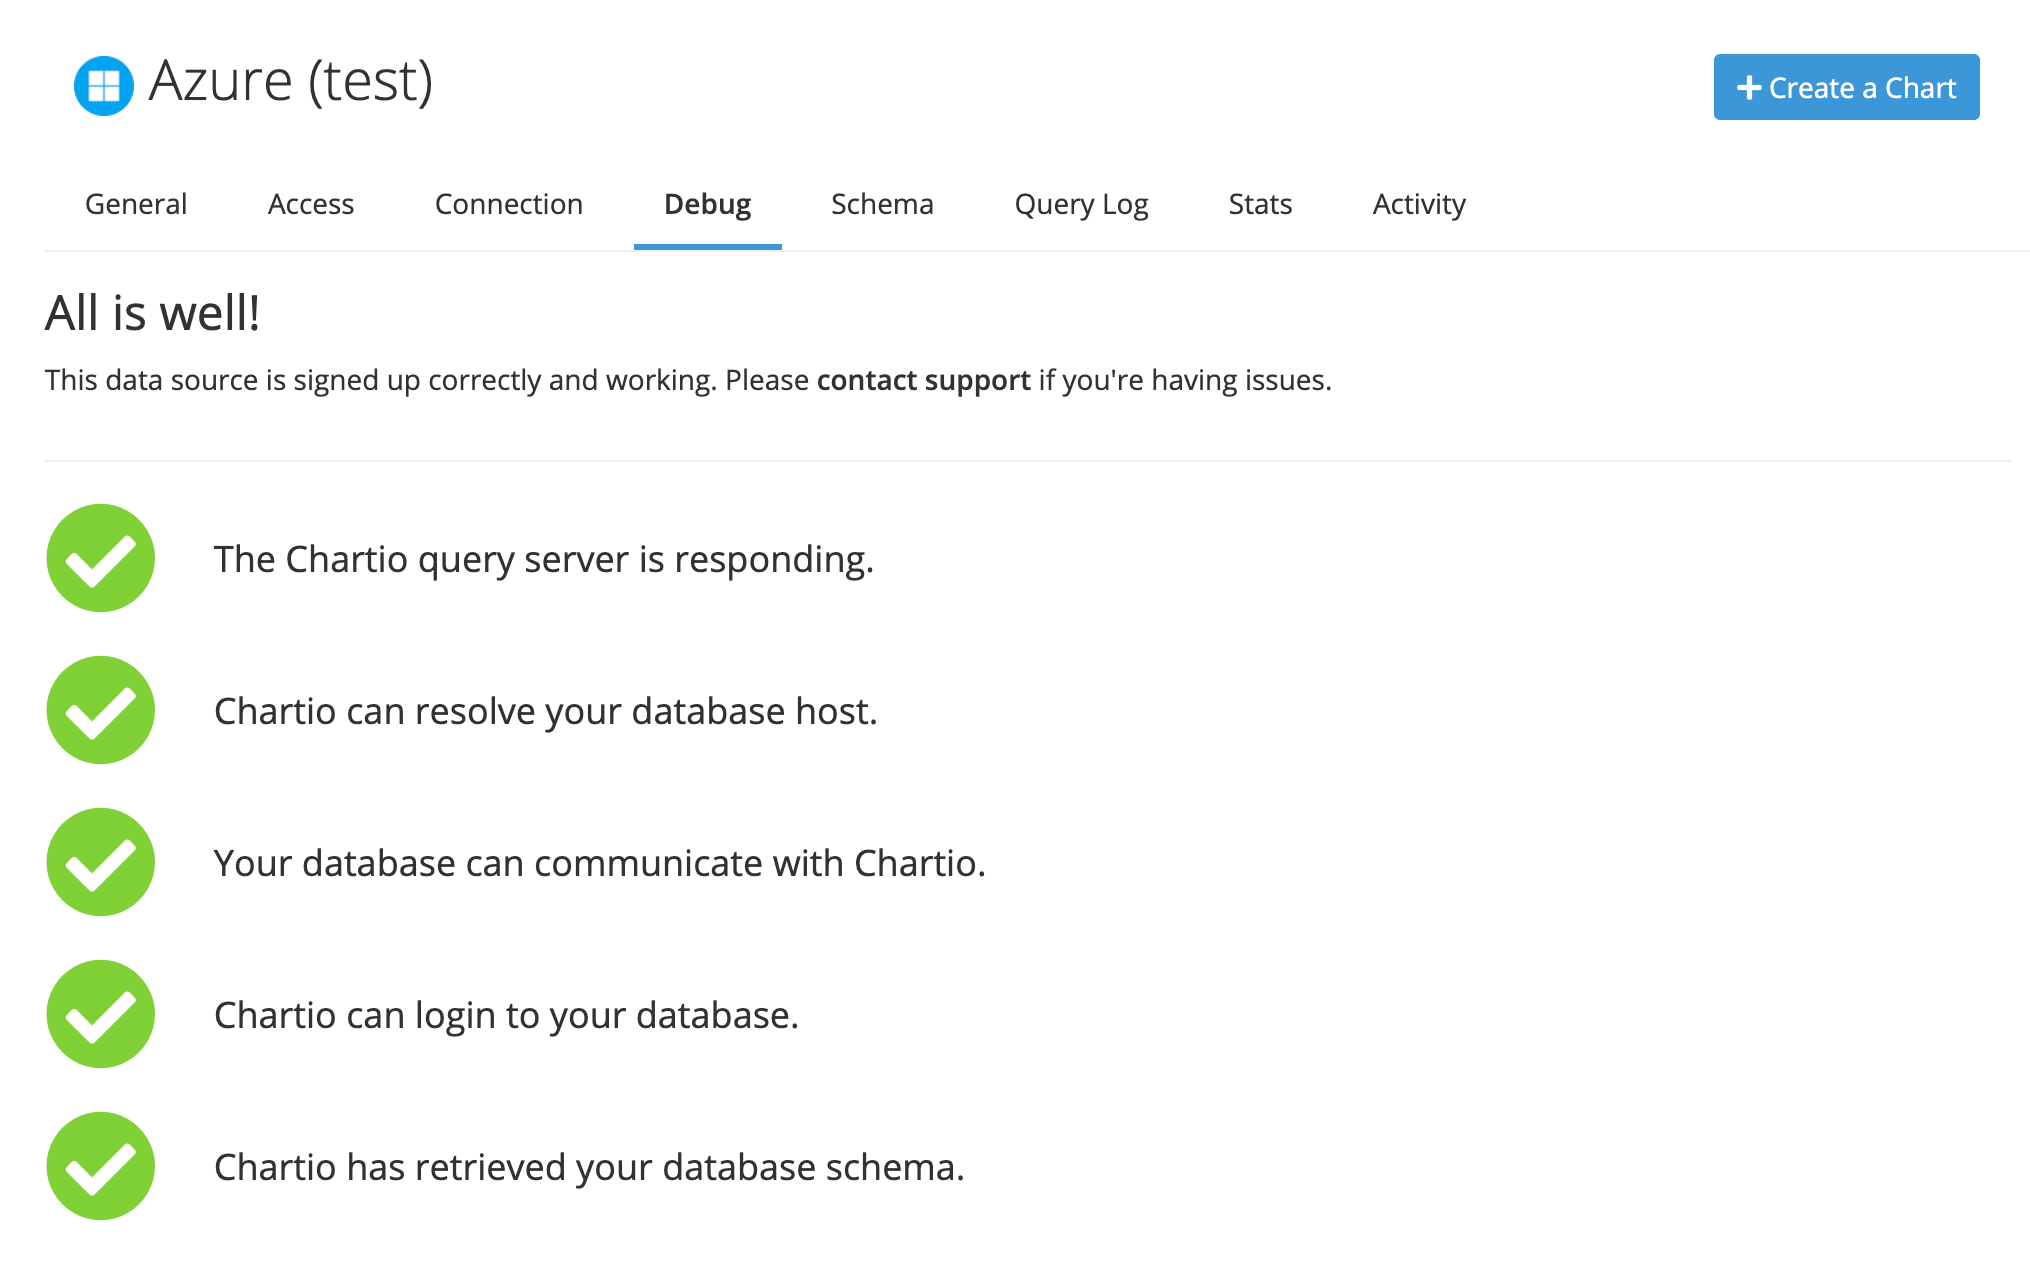
If something is wrong, the interface will tell you where it failed and provide a description of what might be happening, along with the steps you can take to fix it.
Schema
You can customize the schema for your data source. For more information, view our detailed schema page.
Query log
The Query Log tab shows you all the running and completed queries for a particular data source. Check out our Query Log page for more information.
Stats
The Stats tab shows you usage statistics for a particular data source. Check out our Usage Stats page for more information.
Activity
The Activity tab shows all actions taken by users on a particular data source. Check out our Data Source Activity page for more information.
Queries
The Queries tab contains the Queries search, where you can quickly see recently failed queries or search for usage of tables, columns, or other SQL snippets. Check out our Manage Queries page for more information.
Change History
The Change History tab shows a detailed list of changes applied to your Chartio schema. Check out our Manage Schema page for more information.