Change a column's data type
If you’d like to use a column in a different data type than the one in your schema and can’t change the data type in your database, you can use custom columns to change the column’s data type in Chartio.
Note: Some data types such as arrays, JSON objects, and XML objects are not supported by Chartio, so their data type in your Chartio schema will show as “Unsupported Type”. While you could create custom tables, custom columns, or Data Stores to flatten those objects or cast the columns as strings in Chartio, we recommend handling this in the database itself for more flexibility and better long-term management.
For example, you may have a date column that classified as a string in your schema but would like to use it as a date.
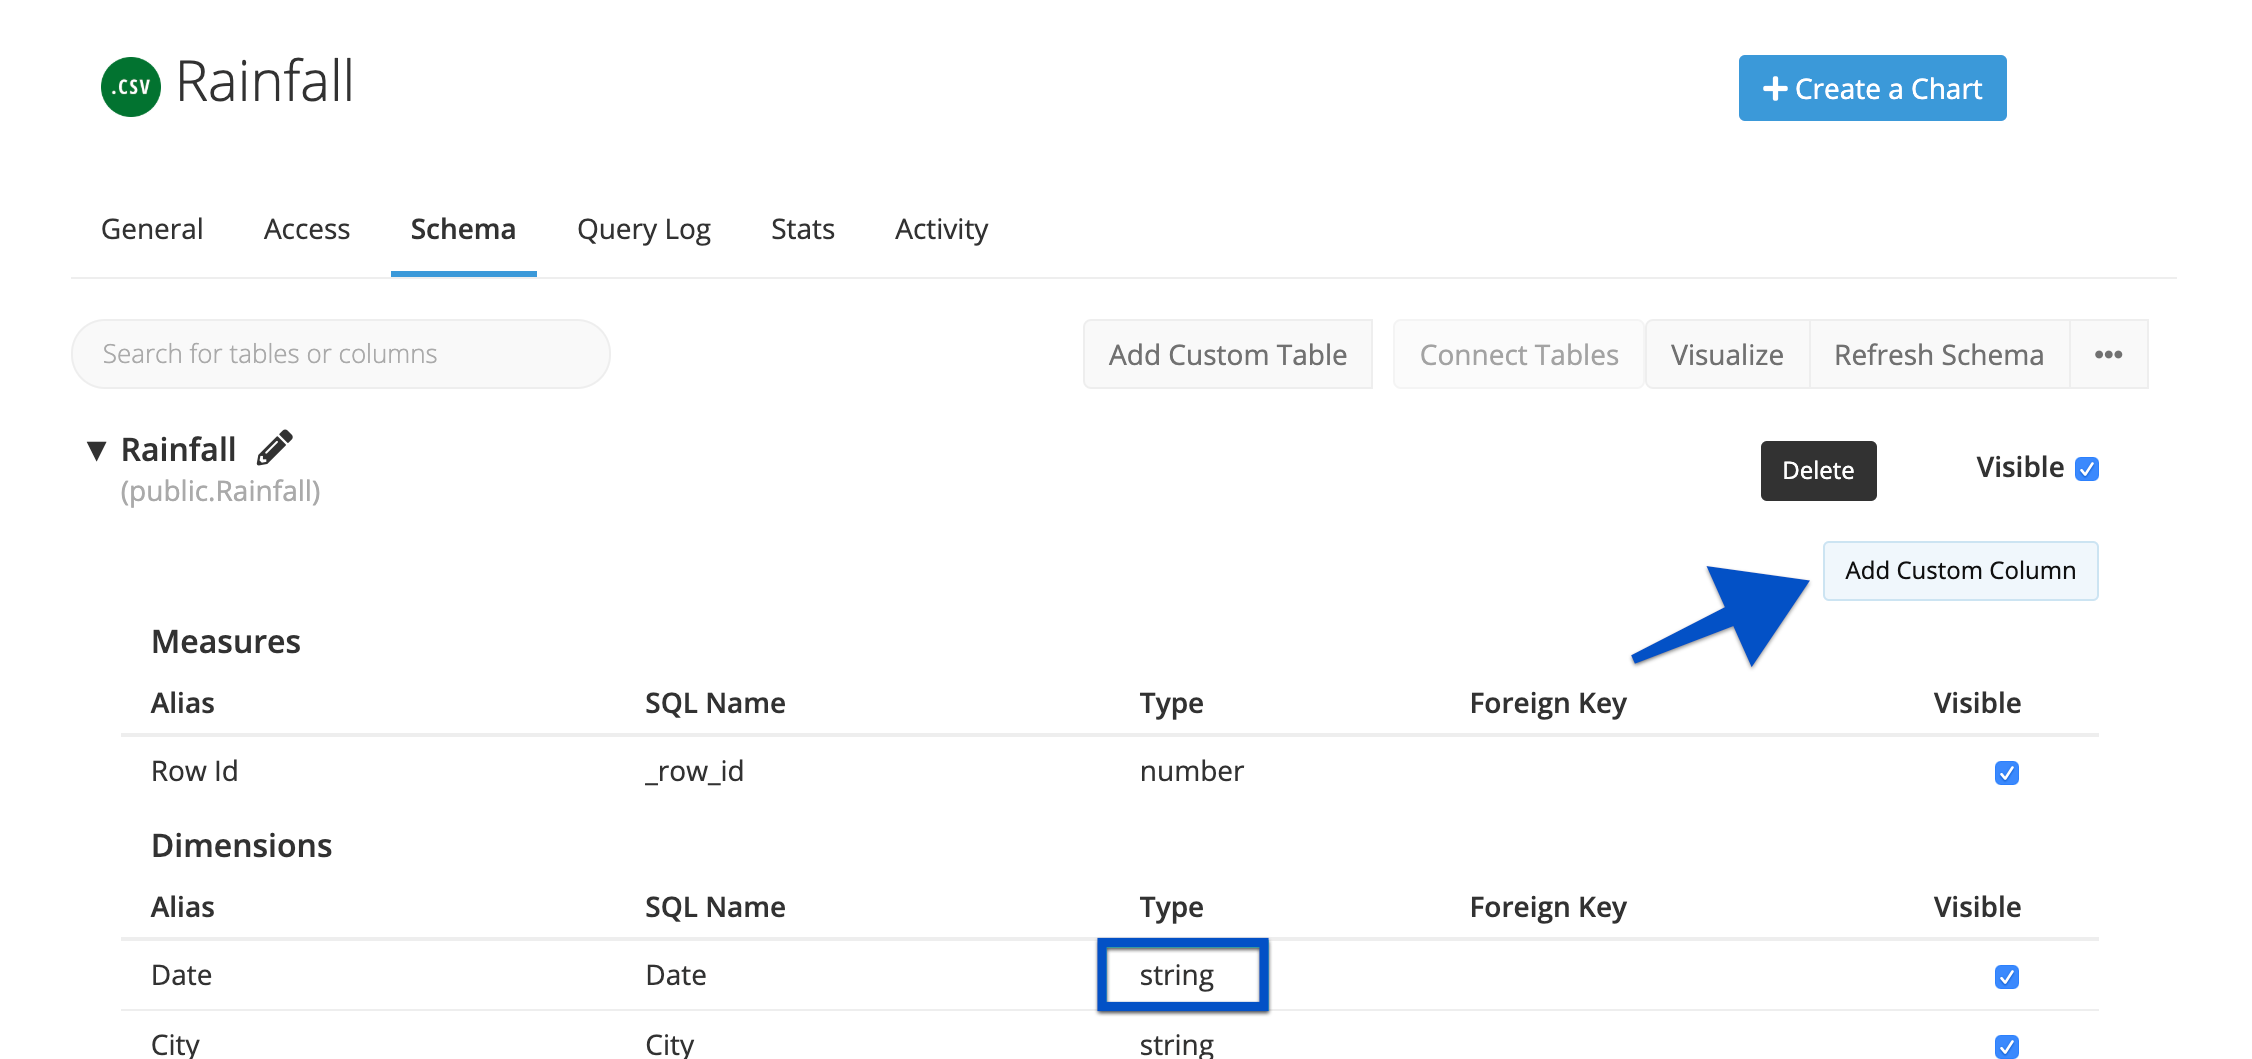
Go to the Data Sources page, select your data source, and switch to the Schema tab. As you can see, our “Date” column is classified as a string. In order to use Chartio’s built-in date functions, we need to cast it to a date.
To accomplish this, you can create a custom column. Click the Add Custom Column button at the top right of the table that contains the column you want to change.

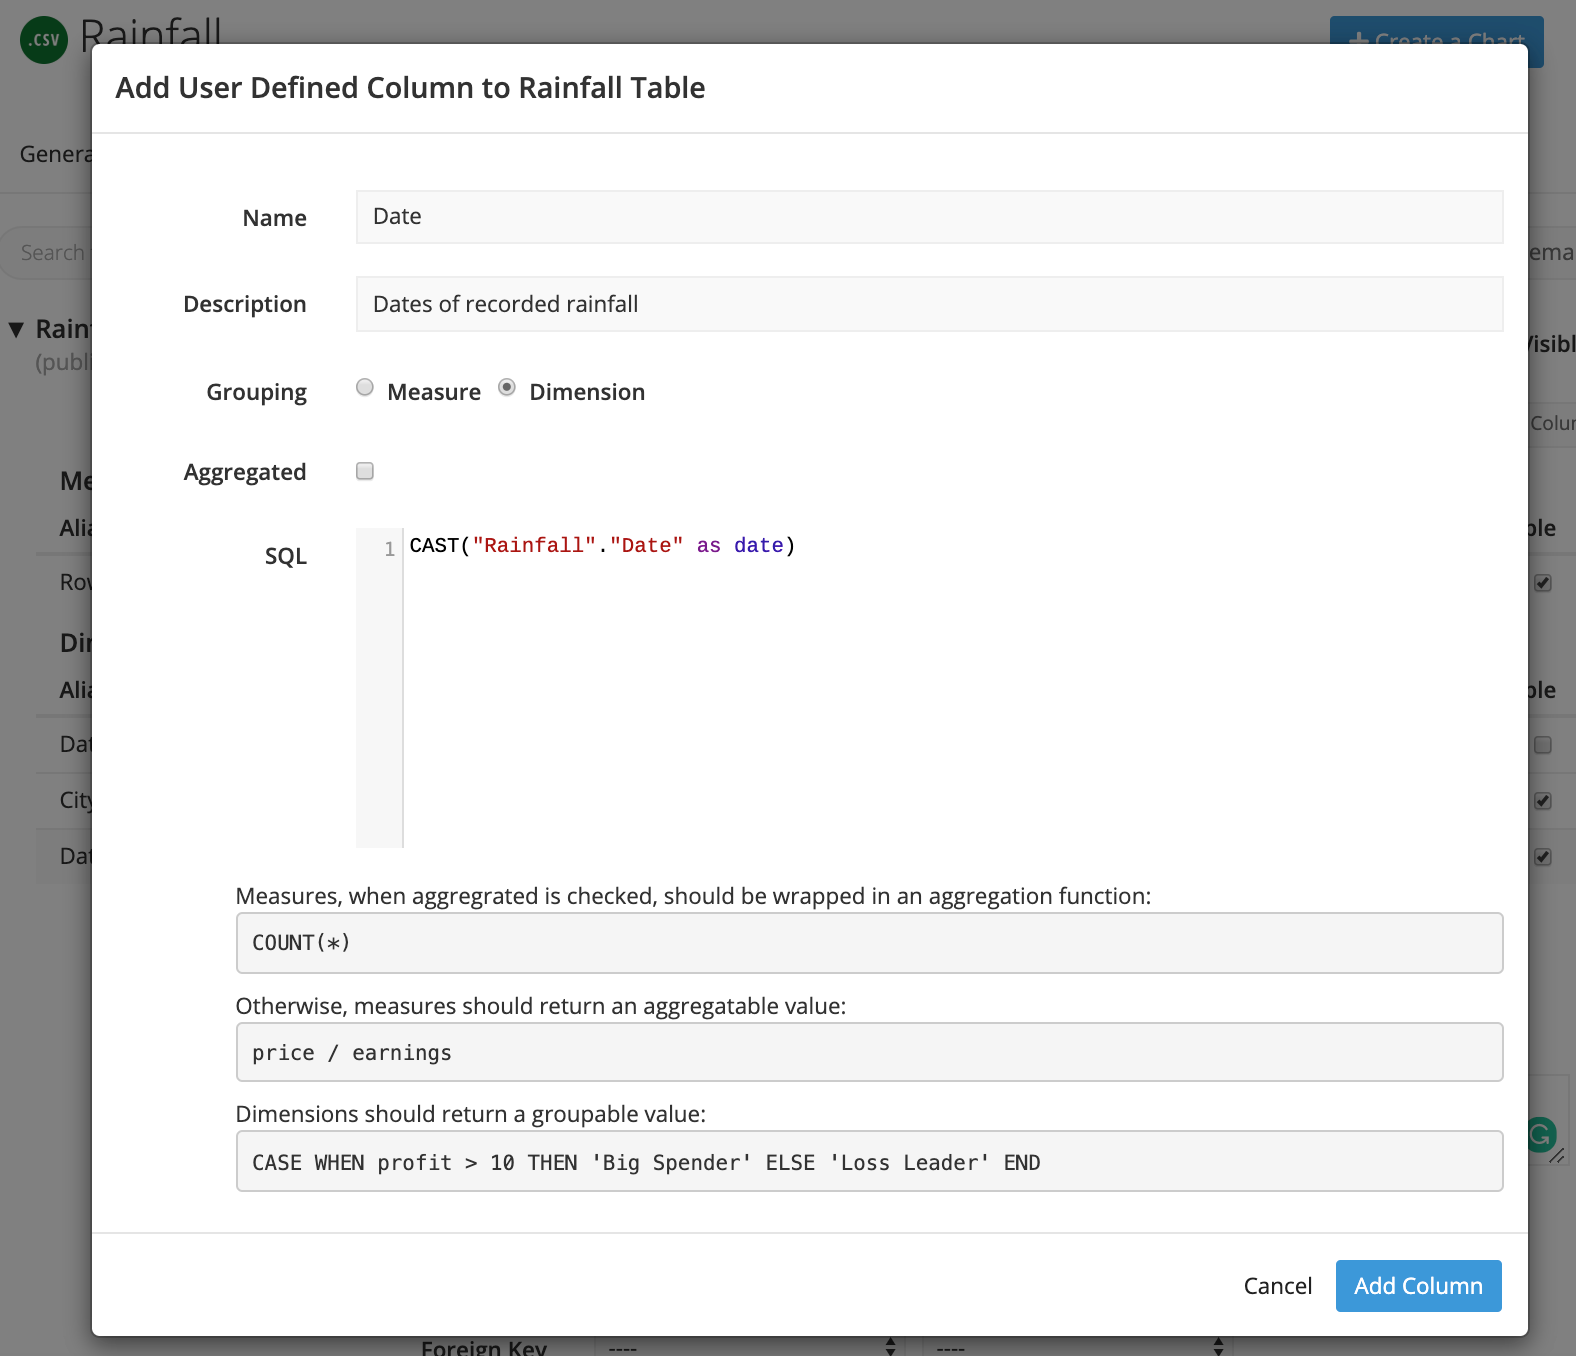
For ease of use, we recommend naming your new column the same as the original column. Be sure to select the correct data type from the Type dropdown as well.
Consult the documentation for your database type to determine the correct syntax for casting a column as a date. Some common examples are listed below.
| Database | Syntax |
|---|---|
| MySQL |
str_to_date(table_name.column_name, '%m-%d-%Y')
|
| PostgreSQL, CSVs, Data Stores |
cast("table_name"."column_name" as date)Check out our CSV example below. |
| Google BigQuery |
date(table_name.column_name)
|
| Google Sheets |
Please refer to our information about date formatting in Google Sheets to learn more. Note: If you're getting an error, verify the resulting date values are in the format |
CSV example
The data source in this example is a CSV and we used the format below. Fill in all the information for the new column and click Add Column when finished.

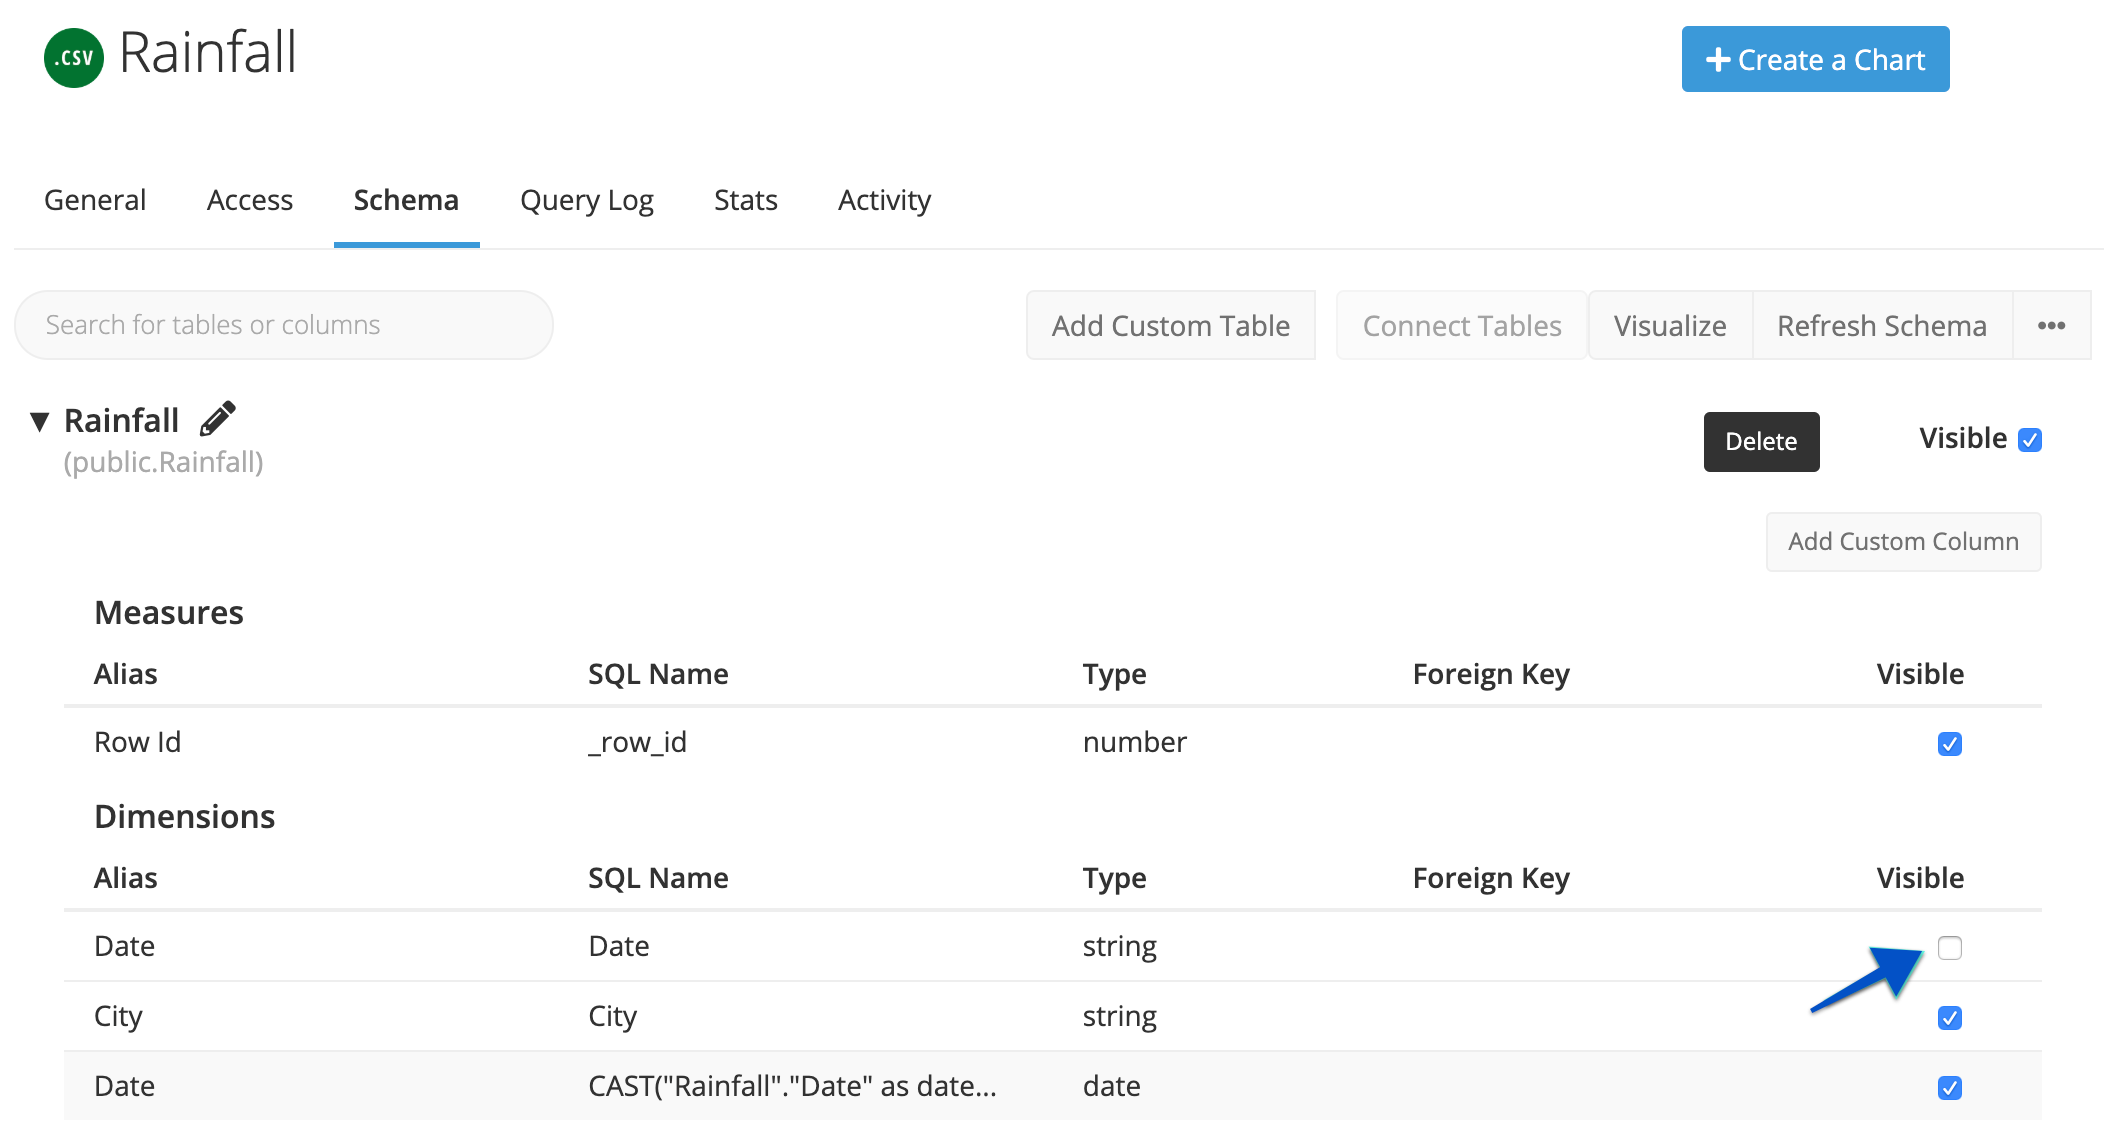
Because we always want to use our new custom column, we’re going to hide the original column in the schema by unchecking the Visible checkbox. This will hide the original column so it won’t be seen in the chart editor.

Now we can use our new column as a date in Visual Mode.
If you don’t want to change a column’s data type in your Chartio schema, you can still change its data type for individual charts. Check out our FAQ showing examples of how to change a column’s data type in the Pipeline.