Create custom Date Buckets using Dropdowns
A Date Bucket allows dashboard viewers to change the time buckets for any charts it’s connected to; however, you can’t directly limit the time bucket options. Instead, you can create a custom Date Bucket using a Dropdown.
For this example, we’ll create a custom Date Bucket that excludes the Minute and Hour time buckets.
In the Visual SQL interface
-
Create a Dropdown with the hard-coded time bucket values you want to display. Make sure the time bucket values are lowercase and Multi-select remains deselected; otherwise, your custom Date Bucket won’t work.
Here’s the SQL for excluding the Minute and Hour time buckets:
 select 'date' as "date_bucket_options"
 union
 select 'week'
 union
 select 'month'
 union
 select 'quarter'
 union
 select 'year'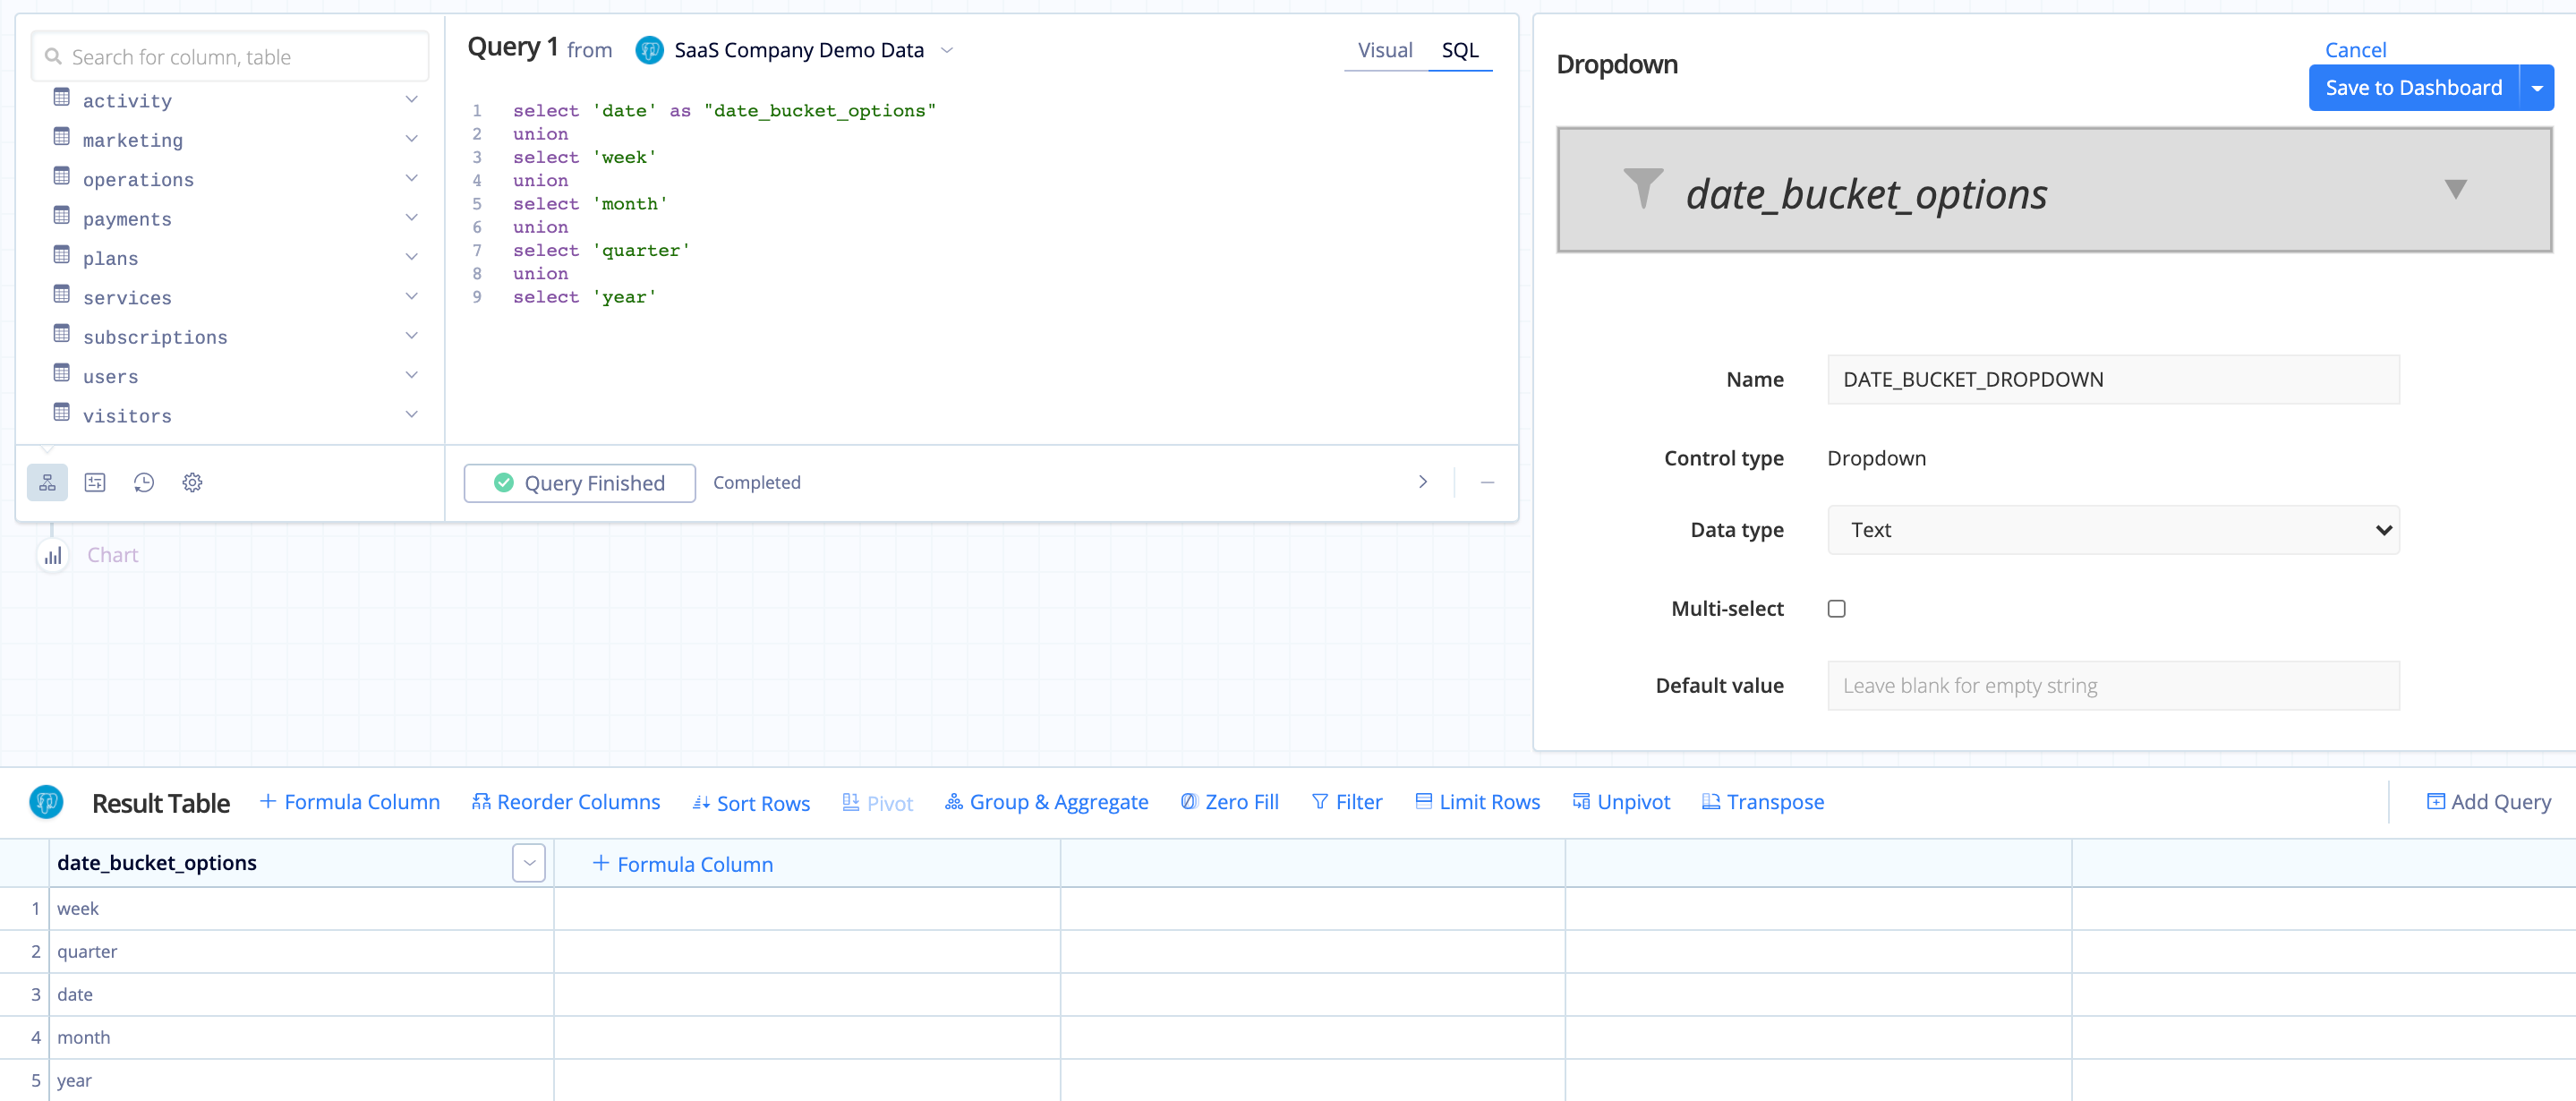
-
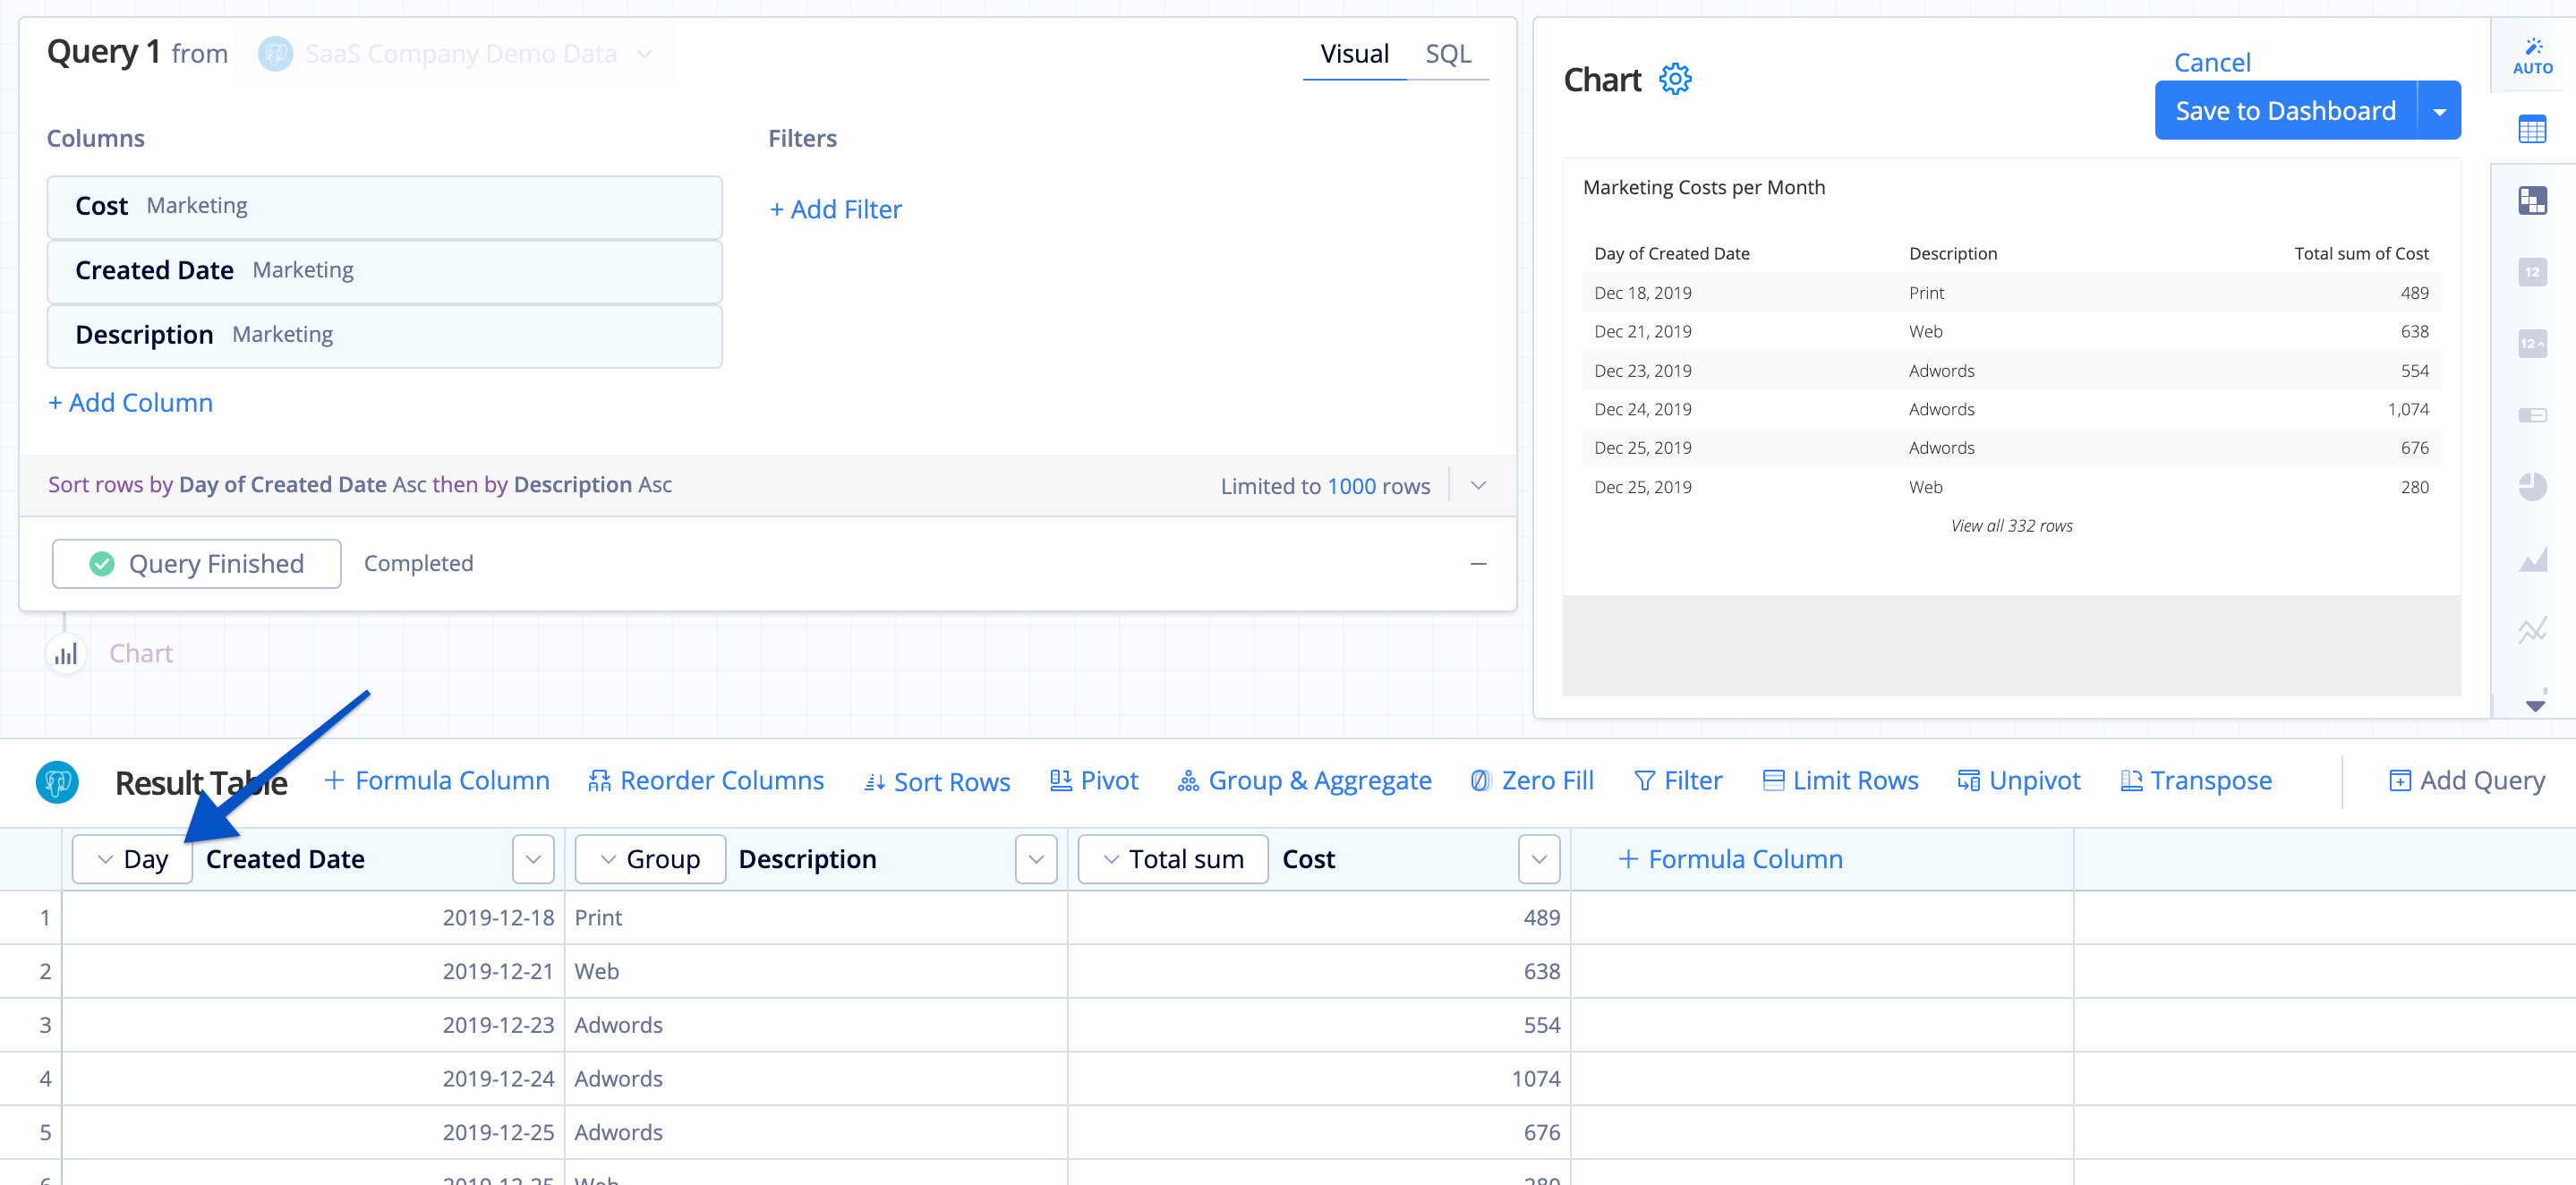
Edit the chart you’d like to connect the custom Date Bucket to and ensure the date/datetime column in your query uses the Day time bucket.
Note: If you want to keep the Minute or Hour time buckets in your custom Date Bucket, your date/datetime column needs to use the Second time bucket for the Control to work properly.
-
Use Apply Formula on the date/datetime column, select Custom as the formula type, and create a CASE statement to specify how the values should be formatted based on the selected value in the custom Date Bucket.
Here’s the CASE statement we need for our example:
 case
     when {DROPDOWN_NAME}='date' then strftime('%Y-%m-%d',"datetime_column_name")
     when {DROPDOWN_NAME}='week' then datepart("datetime_column_name", 'year')||'-W'||((strftime('%j', date("datetime_column_name", '-3 days', 'weekday 4')) - 1) / 7 + 1)
     when {DROPDOWN_NAME}='month' then strftime('%Y-%m',"datetime_column_name")
     when {DROPDOWN_NAME}='year' then strftime('%Y',"datetime_column_name")
     when {DROPDOWN_NAME}='quarter' then strftime('%Y', "datetime_column_name")||'-Q'||((datepart("datetime_column_name", 'month')+2)/3)
     else "datetime_column_name"
 end
If you want to include Minute and Hour, check out our FAQ for connecting Dashboard Controls in the Pipeline to get the case template for each time bucket.
-
Add a Group & Aggregate Action to Group by your changing date/datetime column and choose the appropriate aggregations for the remaining columns. For this example, select Group for the Description column and Total Sum for the Cost column.
-
Optionally rename your columns to something more meaningful and concise.
-
Save your chart, and that’s it! You’ve now created and connected your custom Date Bucket.
In the Data Explorer interface
-
Create a Dropdown with the hard-coded time bucket values you want to display. Make sure the time bucket values are lowercase; otherwise, it won’t work.
Here’s the SQL for excluding the Minute and Hour time buckets:
 select 'date' as "date_bucket_options"
 union
 select 'week'
 union
 select 'month'
 union
 select 'quarter'
 union
 select 'year'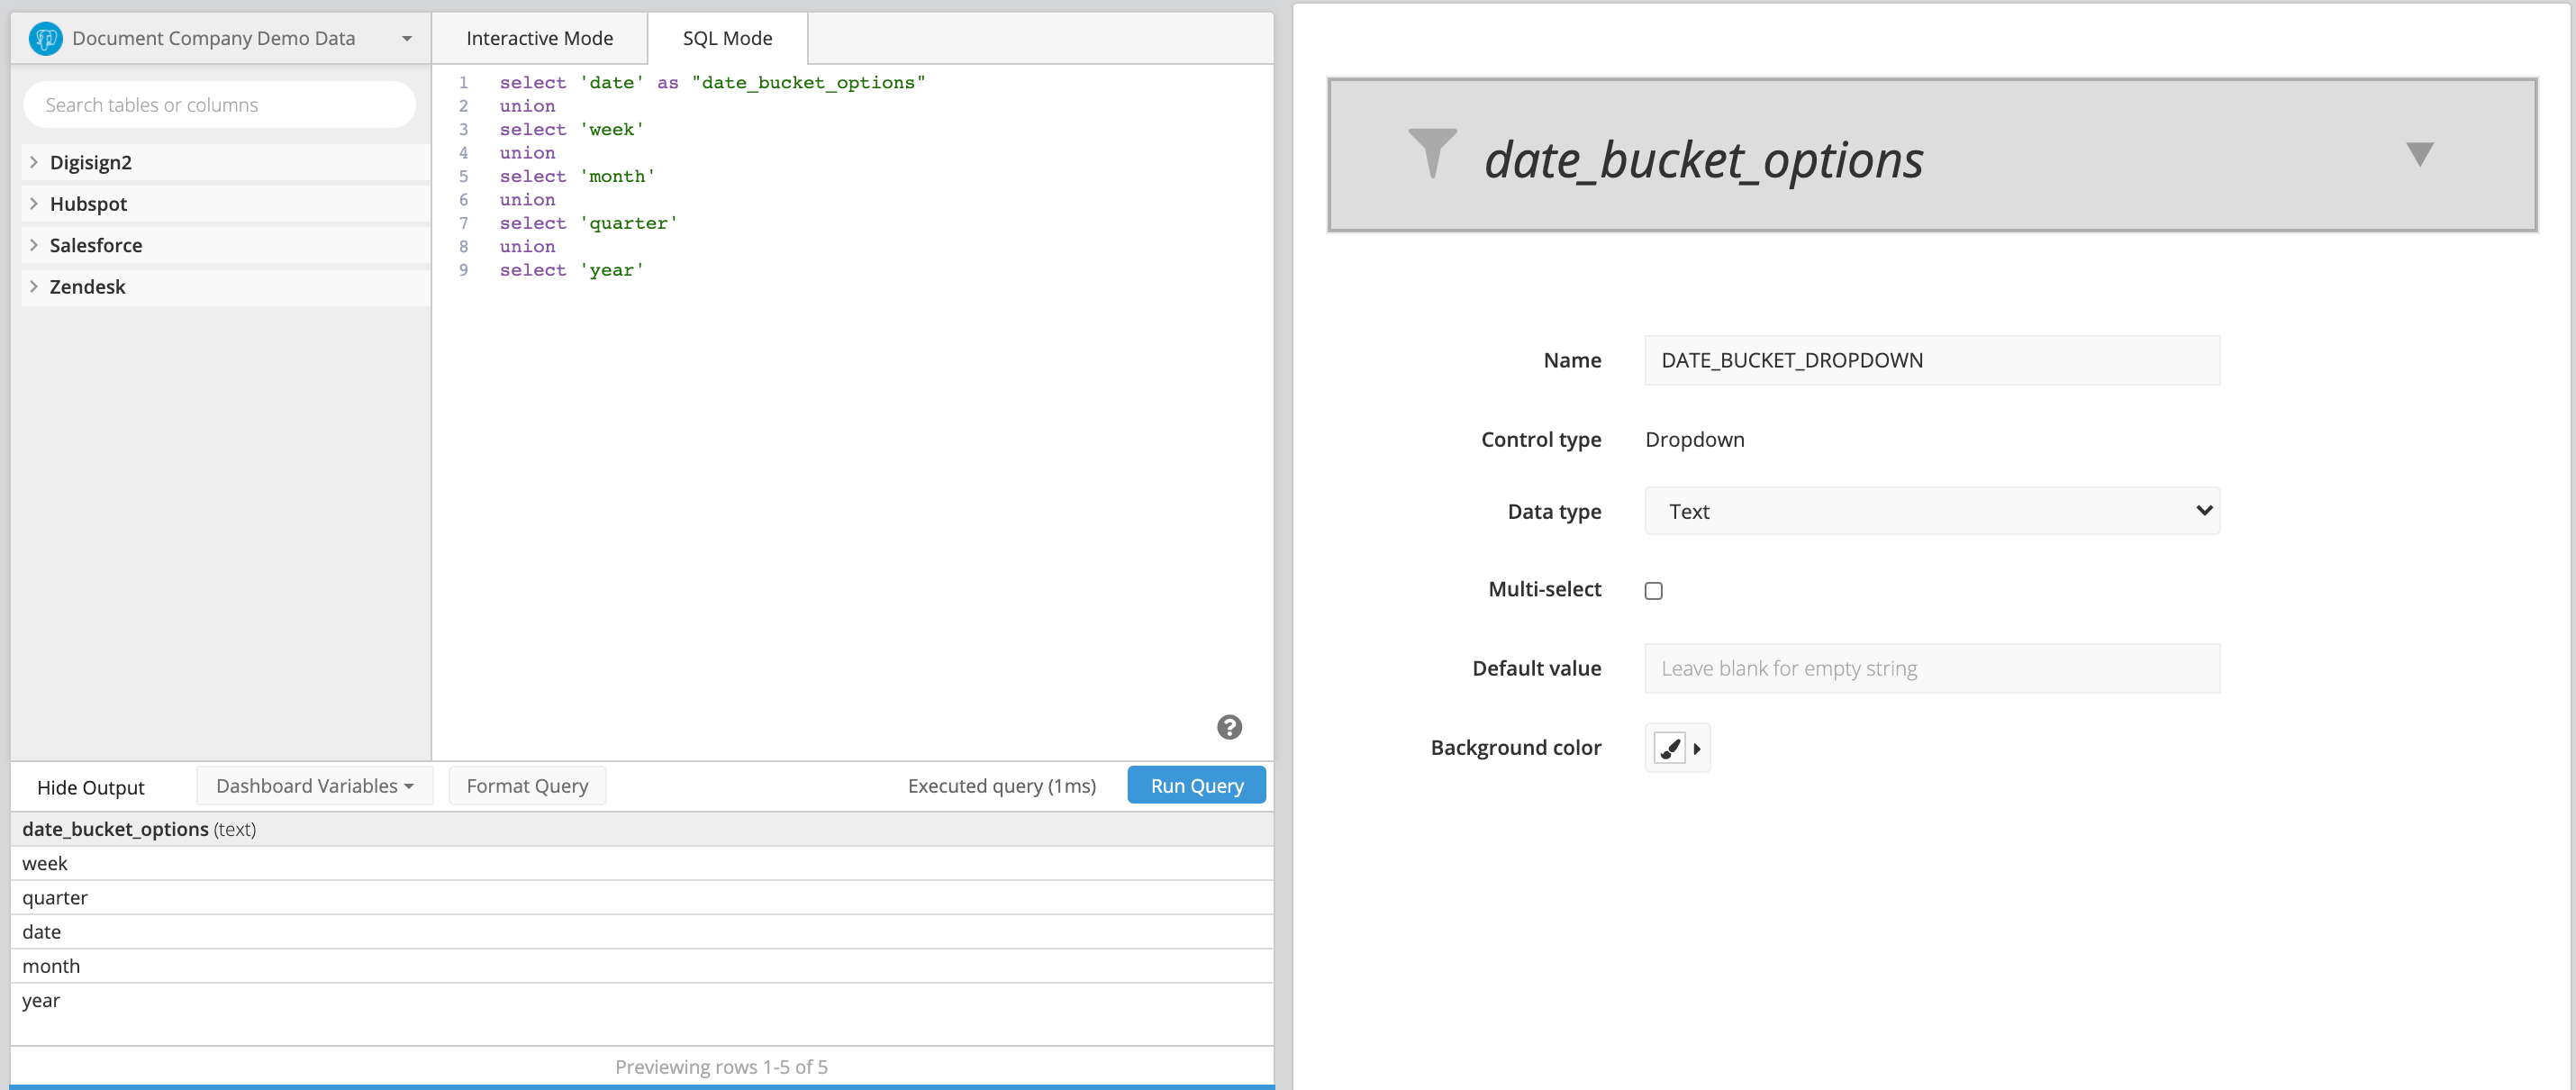
-
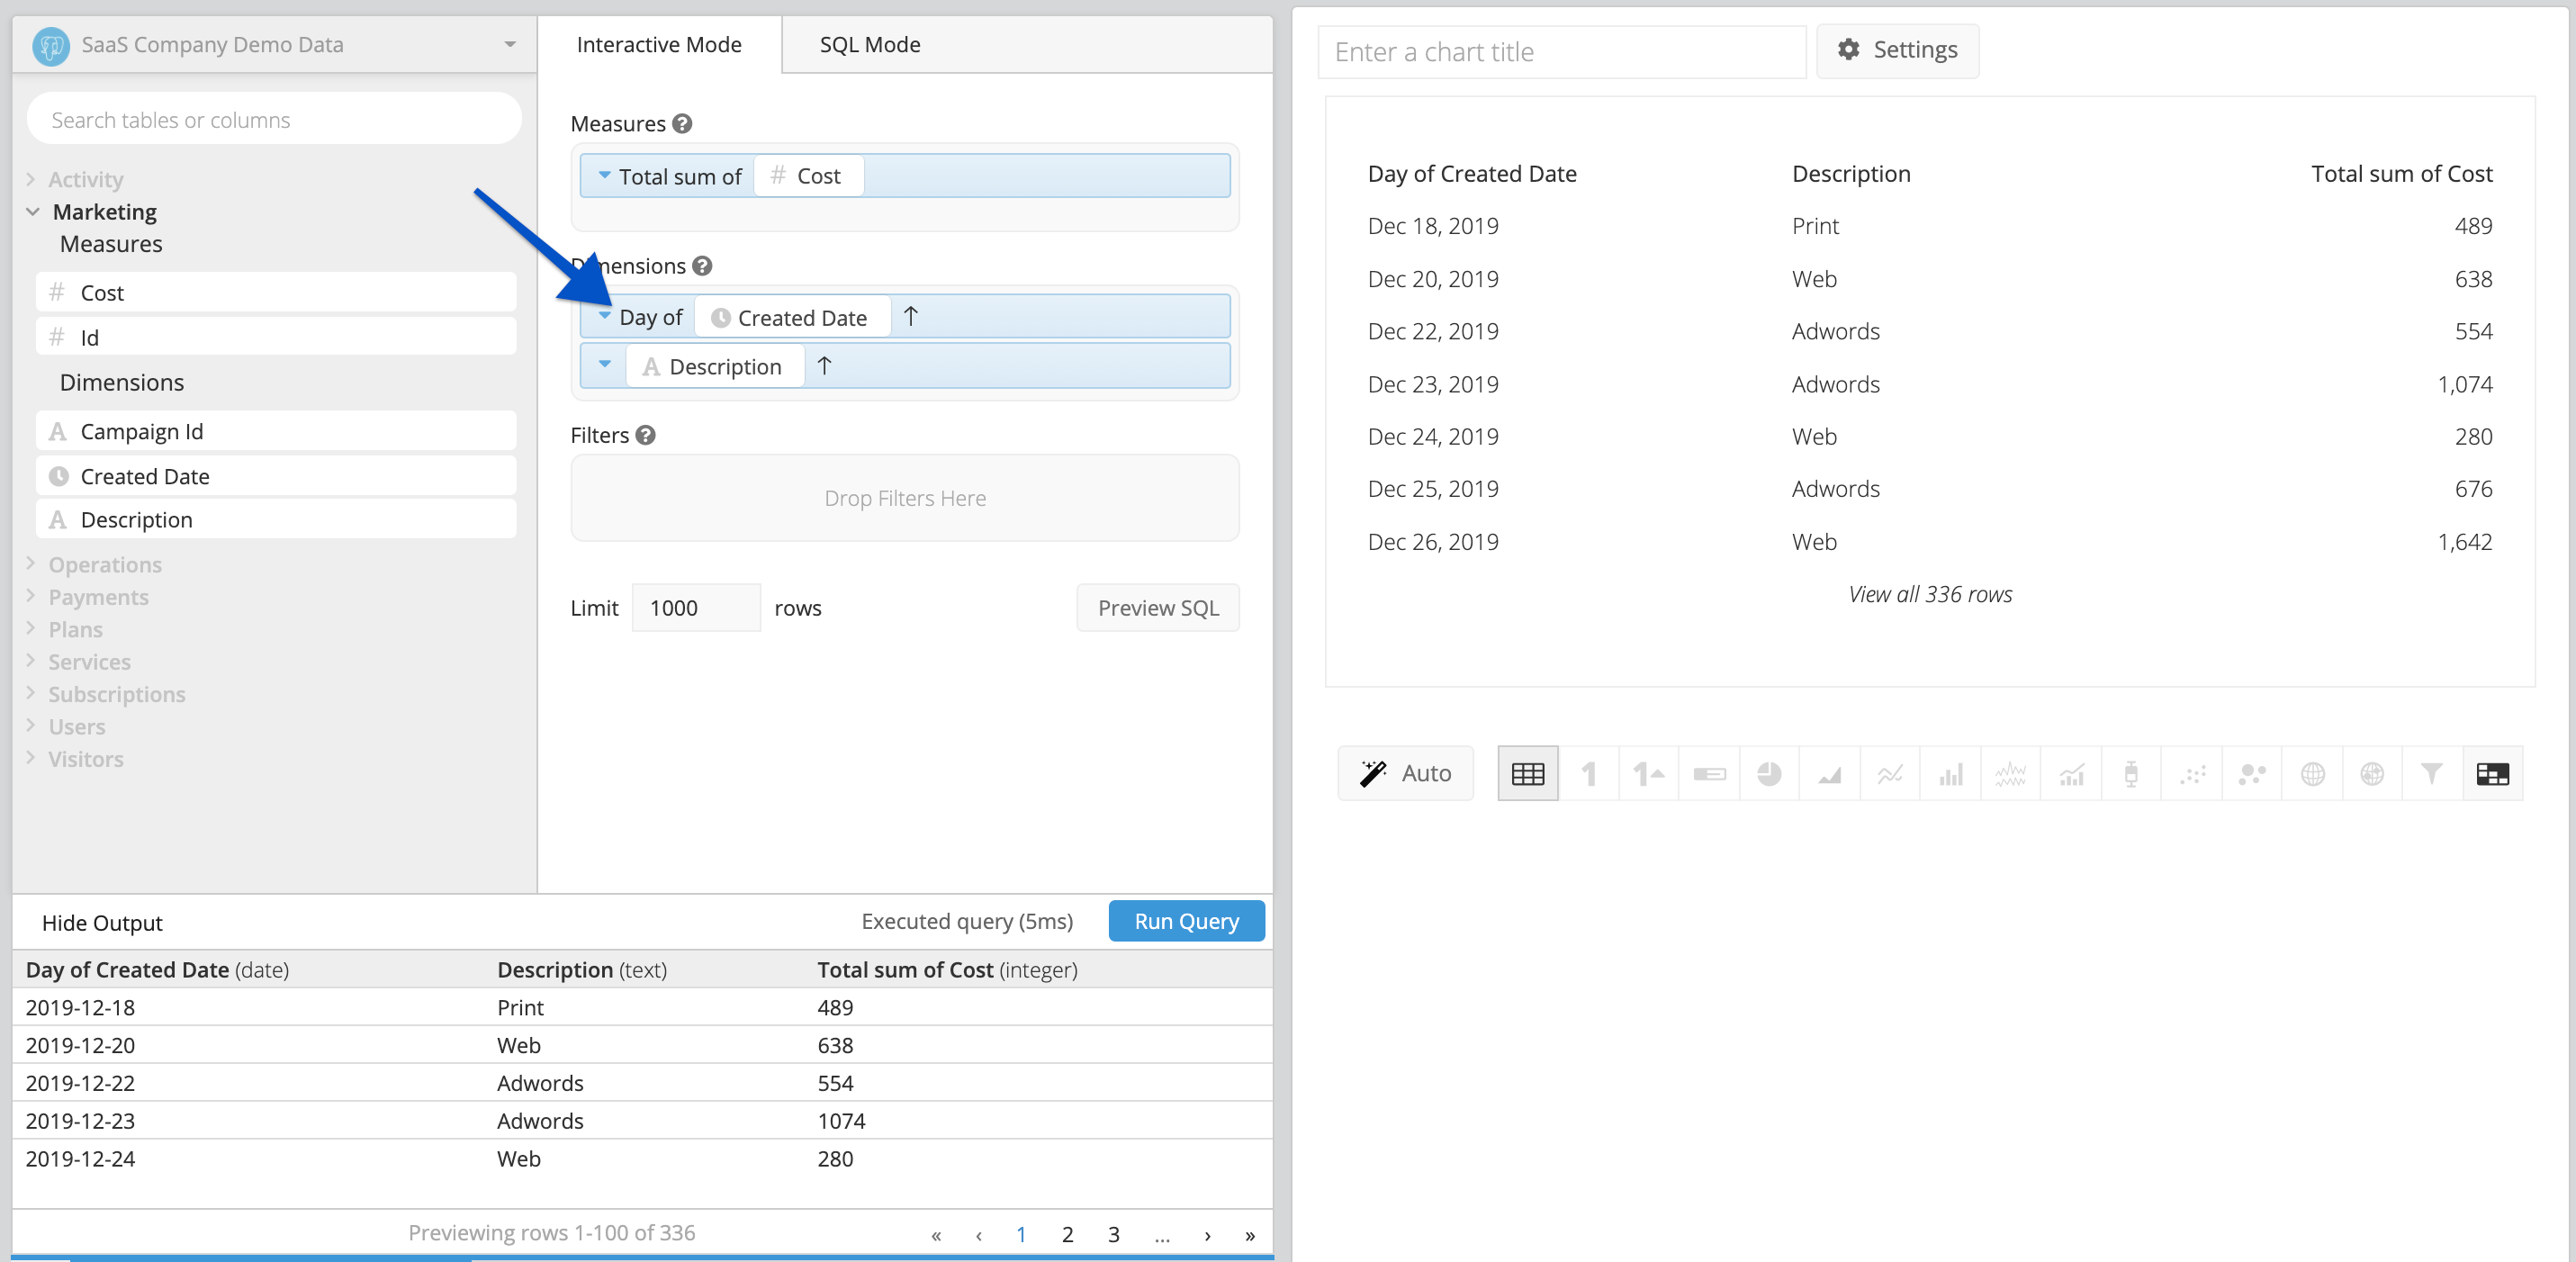
Edit the chart you’d like to connect the custom Date Bucket to and ensure the date/datetime column in your query uses the Day time bucket.
Note: If you want to keep the Minute or Hour time buckets in your custom Date Bucket, your date/datetime column needs to use the Second time bucket for the Control to work properly.
-
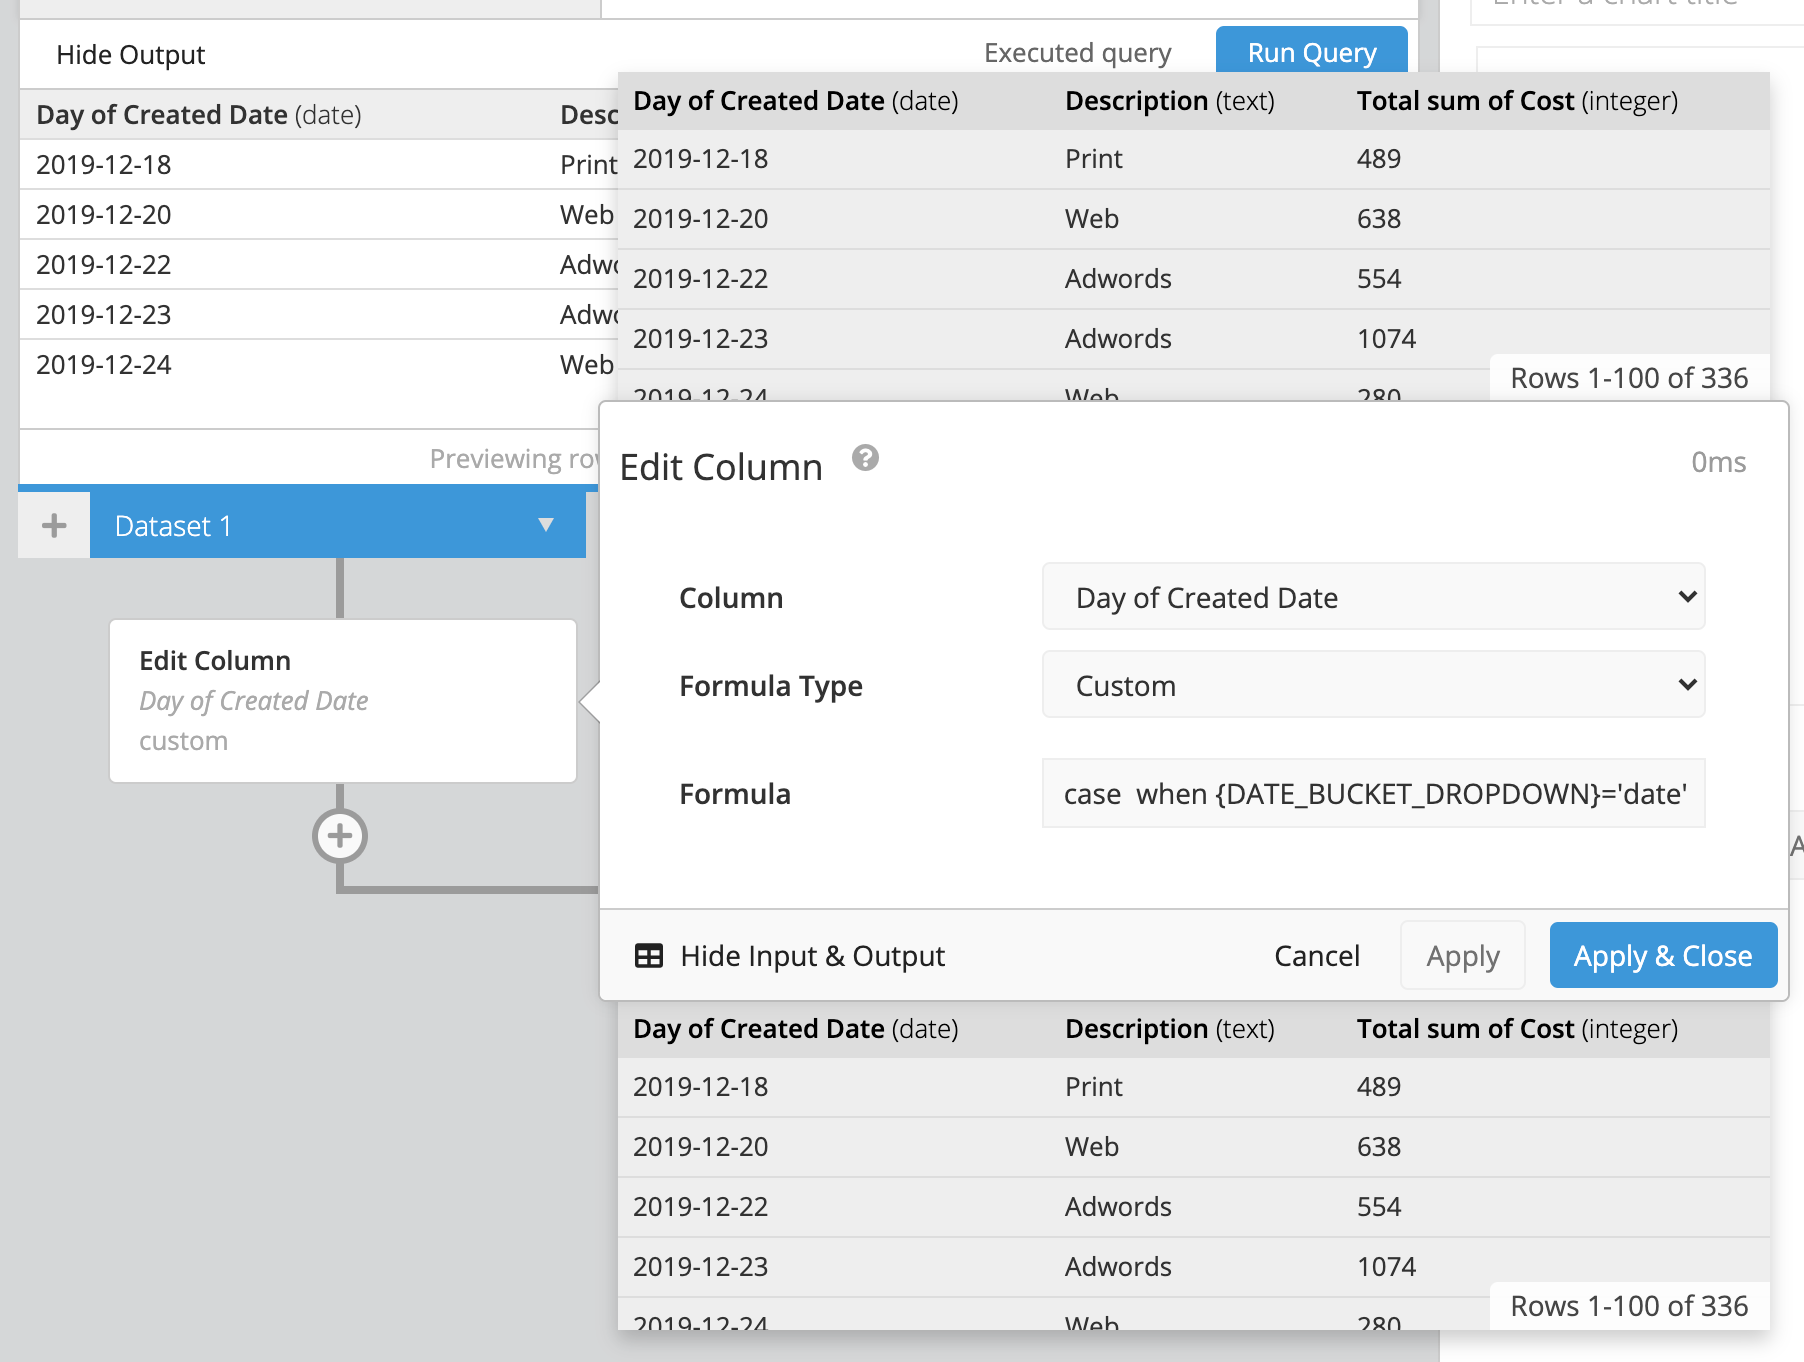
Use Edit Column on the date/datetime column, select Custom as the formula type, and create a CASE statement to specify how the values should be formatted based on the selected value in the custom Date Bucket.
Here’s the CASE statement we need for our example:
 case
     when {DROPDOWN_NAME}='date' then strftime('%Y-%m-%d',"datetime_column_name")
     when {DROPDOWN_NAME}='week' then datepart("datetime_column_name", 'year')||'-W'||((strftime('%j', date("datetime_column_name", '-3 days', 'weekday 4')) - 1) / 7 + 1)
     when {DROPDOWN_NAME}='month' then strftime('%Y-%m',"datetime_column_name")
     when {DROPDOWN_NAME}='year' then strftime('%Y',"datetime_column_name")
     when {DROPDOWN_NAME}='quarter' then strftime('%Y', "datetime_column_name")||'-Q'||((datepart("datetime_column_name", 'month')+2)/3)
     else "datetime_column_name"
 end
If you want to include Minute and Hour, check out our FAQ for connecting Dashboard Controls in the Pipeline to get the case template for each time bucket.
-
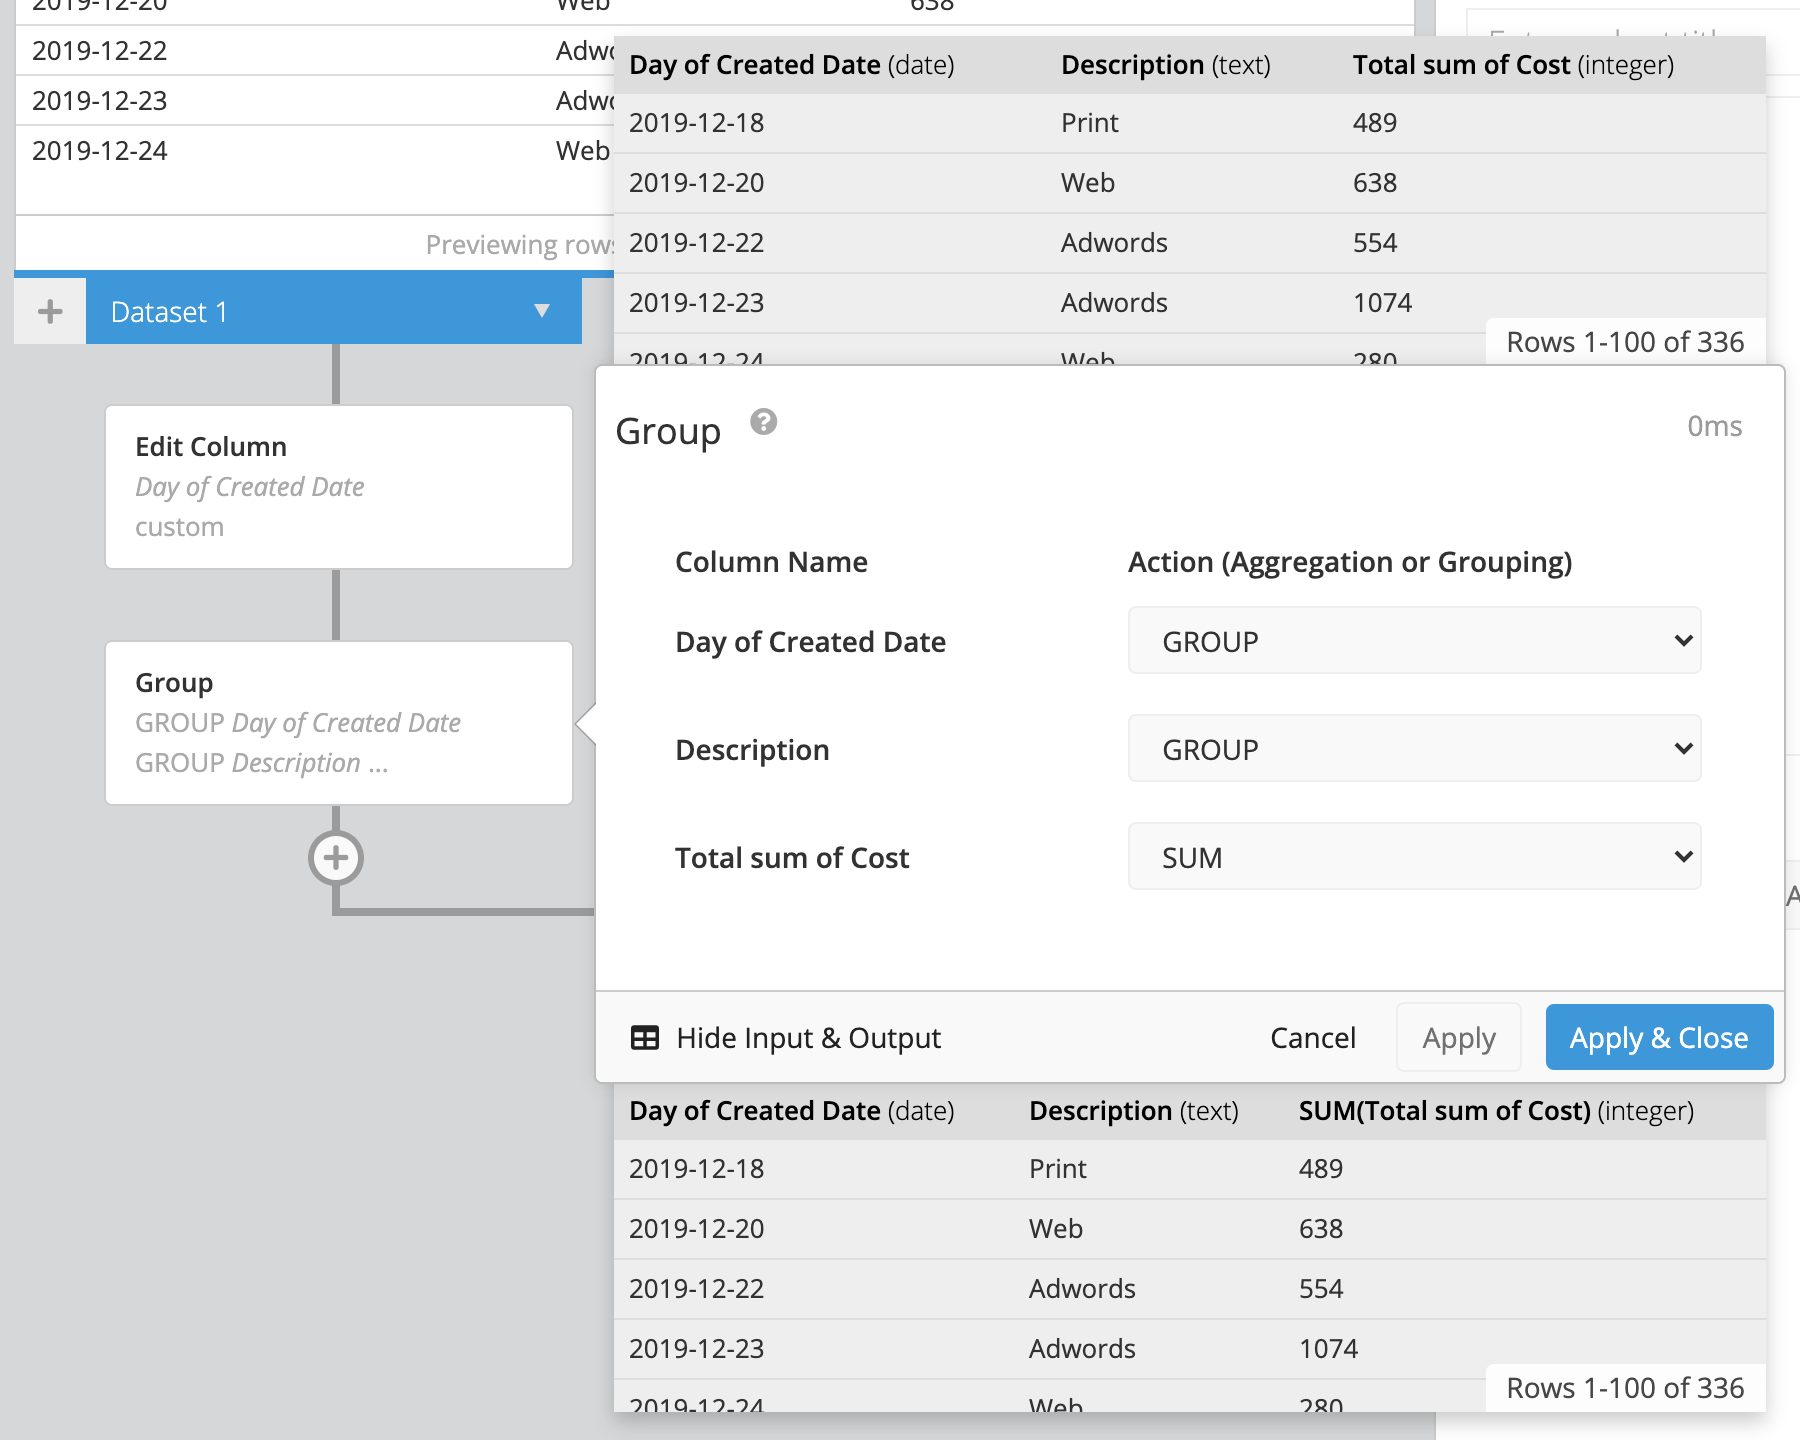
Add a Group Step to Group by your changing date/datetime column and choose the appropriate aggregations for the remaining columns. For this example, select Group for the Description column and Sum for the Cost column.
-
Optionally rename your columns to something more meaningful and concise.
-
Save your chart, and that’s it! You’ve now created and connected your custom Date Bucket.