Filter with multi-select Dropdowns in the Pipeline
The most straightforward way to connect your multi-select Dropdowns in the Pipeline is to add a Filter Action (Visual SQL) or Filter Rows Step (Data Explorer) and use the “is one of” operator when setting up your filter condition (i.e., "column_name" is one of {DROPDOWN_NAME}). However, if you have the “Show All” setting selected for your Dropdown, that method doesn’t handle this setting. This article describes an alternate method to connect your multi-select Dropdown in the Pipeline and still handle the “Show All” setting.
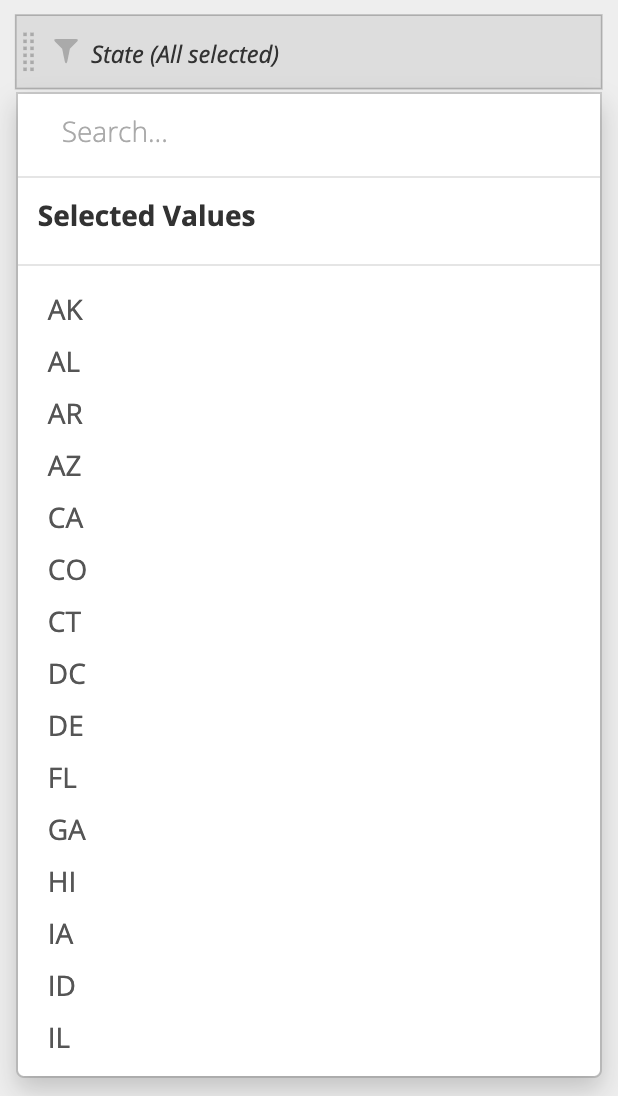
Let’s say we have a Dropdown that lists all of the states in the United States on your dashboard and has the following settings:
- Multi-select is selected
- Empty state is Show All
- Initial value(s) is deselected
We want to select multiple states in the Dropdown and have our chart filter on those states. Again, we could connect it in our query by adding the State column to the Filters section and using the “is one of” operator, but let’s say we don’t want to do that because we need the initial query not to filter on any state selections. Therefore, the filtering must be done in the Pipeline by following the steps below:
In the Visual SQL interface
-
First, ensure the column you want to filter on is included in your result set. Unlike filtering directly in the Query, you need the column in your result set so you can reference it in the Pipeline. For this example, the State column must be in the result set.

-
Next, create a boolean column that depends on the values of the column to filter (i.e., the State column). If we want to include the row in our results, the boolean column should show a
1; otherwise, it should show a0.Add a Formula Column, select Custom as the Formula Type, and use the following CASE statement as the formula, replacing
DROPDOWN_NAMEwith the name of your Dropdown Control andStatewith the name of the column you’re using to filter:case when {DROPDOWN_NAME.IN('"State"')} then 1 else 0 endThis will connect the Dropdown to your chart.
-
Now add a Filter Action to correctly filter on the Dropdown selections. Select to include rows matching all conditions where the Custom Formula column equals 1 (
"Custom Formula" = 1).Note: If you’re trying to implement an “is not one of” filter, you’d just need to change include to exclude.

-
Lastly, hide the boolean Custom Formula column since it’s no longer necessary. You can also hide the column used to create the boolean column if you no longer need it too.
If you followed these steps correctly, your multi-select Dropdown should now be connected to your chart, and you can filter your chart using multiple selections from the State Dropdown.
This process also works for multi-select Text Inputs. Go ahead and try it out!
In the Data Explorer interface
-
First, ensure the column you want to filter on is included in your result set. Unlike filtering directly in the Query, you need the column in your result set so you can reference it in the Pipeline. For this example, the State column must be in the result set.

-
Next, create a boolean column that depends on the values of the column to filter (i.e., the State column). If we want to include the row in our results, the boolean column should show a
1; otherwise, it should show a0.Use an Add Column Step, give your new column a useful name, select Custom formula as the Formula Type, and use the following CASE statement as the formula, replacing
DROPDOWN_NAMEwith the name of your Dropdown Control andStatewith the name of the column you’re using to filter:case when {DROPDOWN_NAME.IN('"State"')} then 1 else 0 endThis will connect the Dropdown to your chart.

-
Next, add a Filter Rows Step to correctly filter on the Dropdown selections. Select INCLUDE rows and matching ALL conditions from the dropdown where your new column equals 1.
Note: If you’re trying to implement an “is not one of” filter, you’d just need to change include to exclude.

-
Lastly, hide the boolean column since it’s no longer necessary. You can also hide the column used to create the boolean column if you no longer need it too.
If you followed these steps correctly, your multi-select Dropdown should now be connected to your chart, and you can filter your chart using multiple selections from the State Dropdown.
This process also works for multi-select Text Inputs. Go ahead and try it out!