Filter with all values in a Dropdown
When you select the Show All setting for a multi-select Dropdown, this means your chart isn’t filtered when no Dropdown values are selected. Sometimes, you may want your chart to initially filter with all values in the Dropdown. You can manually select each value in the Dropdown, but this can be cumbersome, especially if you have a long list of values. Instead, you can follow these instructions for whichever mode you’re using for your query.
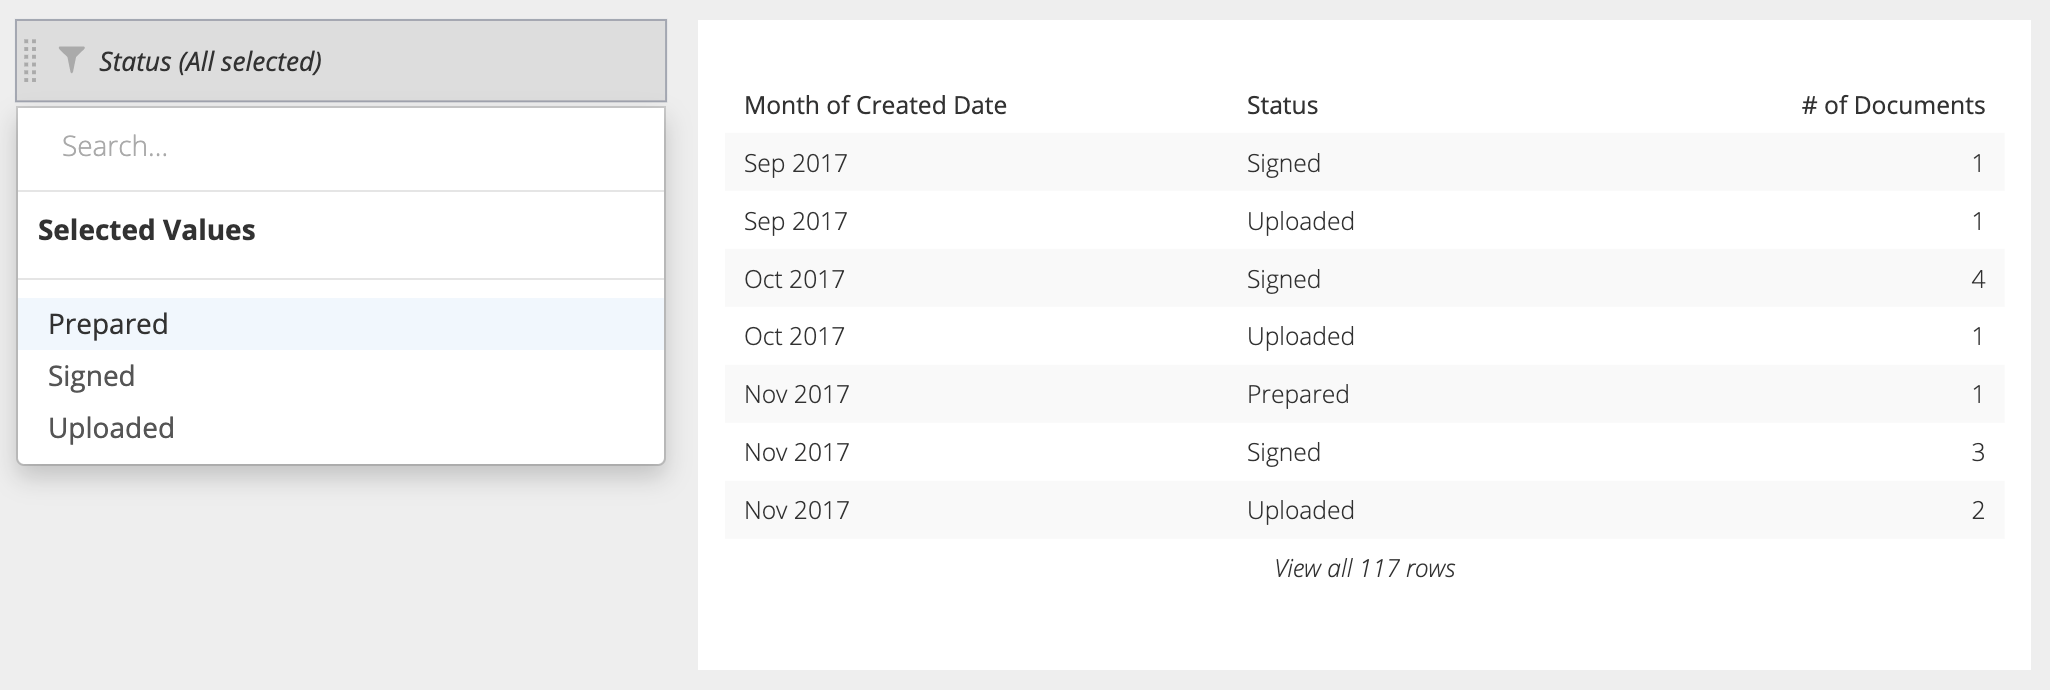
For this example, we have a Dropdown with three document status values: Prepared, Signed, and Uploaded. We select Show All for the Empty State and deselect Initial Values. Our “Status” column actually contains five distinct values, so when we don’t have any values selected in our Dropdown, we see all five statuses in our results.

But what we want is to only see the three values shown in our Dropdown when nothing is selected yet.
There are two different approaches you can take: the Pipeline approach or the SQL Mode approach.
If your chart is connected to a dependent Dropdown, use the SQL query of the dependent Dropdown and not the primary Dropdown where appropriate in the following instructions.
Pipeline approach
In the Visual SQL interface
-
In order to use this Pipeline solution, you must include the column to be filtered in your result set, so modify the appropriate query in your chart to add the column then click Run Query. Don’t worry—you can hide the column at the end if you don’t need it in your final result set.
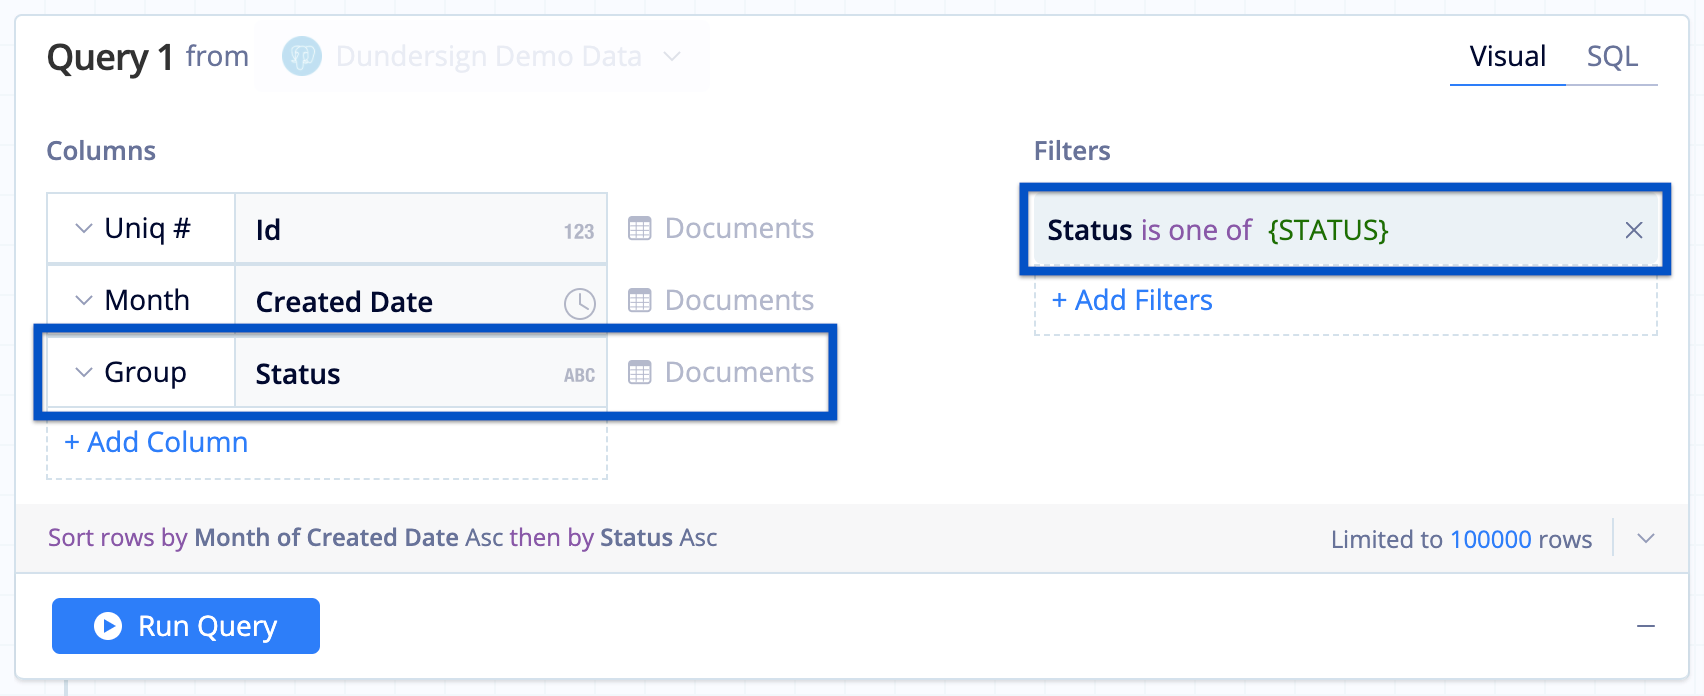
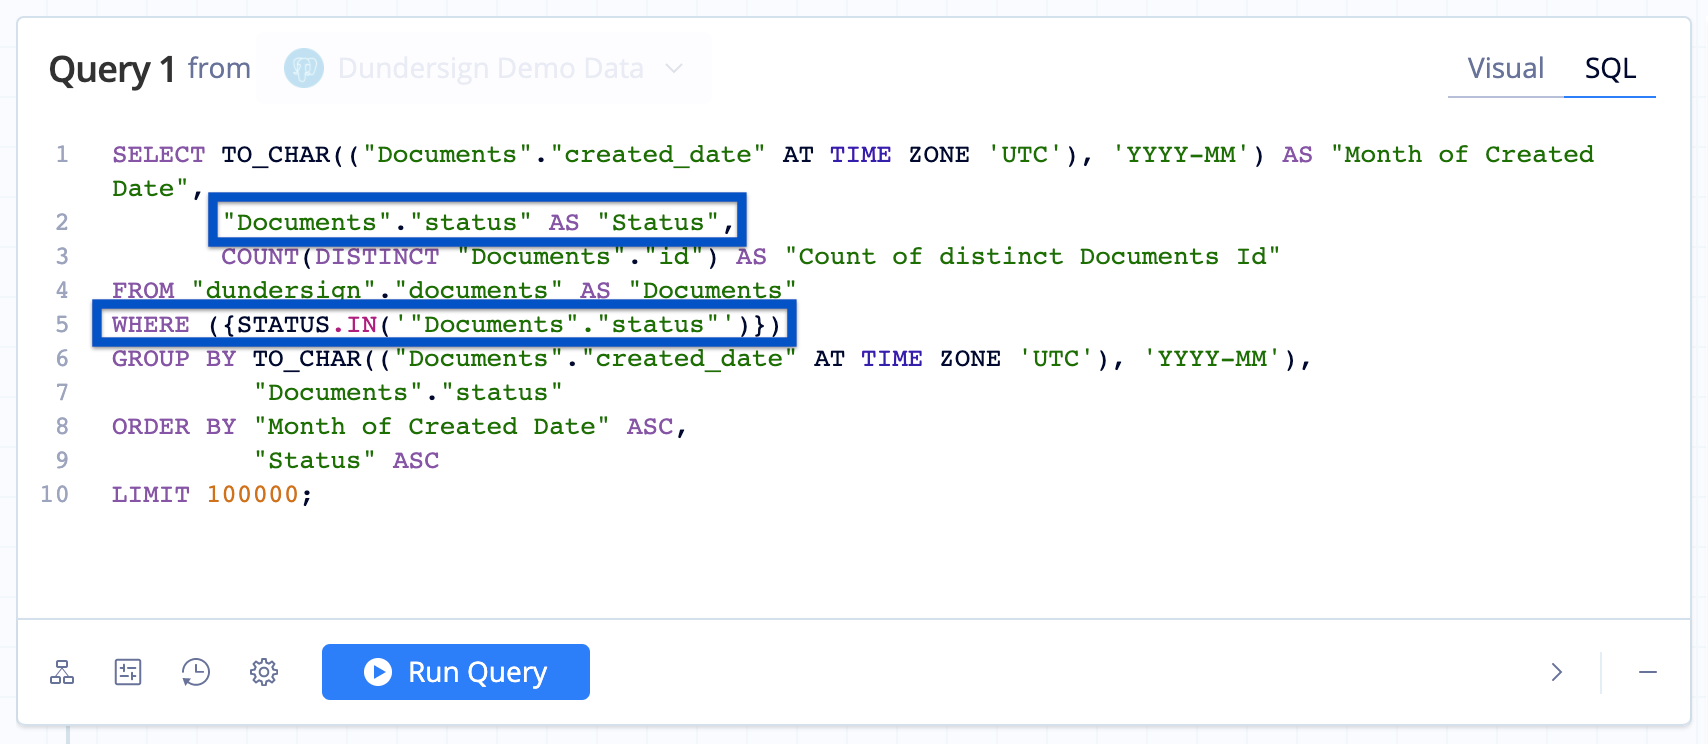
In our example, we make sure to add the “Status” column to our query.
Note: You still need to connect the Dropdown in your Query to ensure your chart will still update when Dropdown values are selected.
Here’s how the Query looks for our example:
-
In Visual Mode
-
In SQL Mode
-
-
If you haven’t already, click the Query that’s connected to your Dropdown to focus on it. New Actions are added below the currently selected Action in the Pipeline.

-
Use a Reorder Action to move the column used for filtering to the leftmost column of your result set.
-
Create another Query that’s identical to the query used to create your Dropdown then click Run Query.
Tip! If you created your Dropdown in Visual Mode, quickly “copy” your Dropdown’s SQL by editing your Dropdown, switch to SQL Mode, copy the generated SQL, and use it for this step.
-
Change the Join Action to use an Inner Join then click Save. Now the results of the original Query are filtered to only show rows relevant to the values in your Dropdown!

-
Reorder the filtered column back to its original position in your final result set—or hide it if it’s no longer necessary.

In the Data Explorer interface
-
In order to use this Pipeline solution, you must include the column to be filtered in your result set, so modify the appropriate query in your chart to add the column then click Run Query. Don’t worry—you can hide the column at the end if you don’t need it in your final result set.
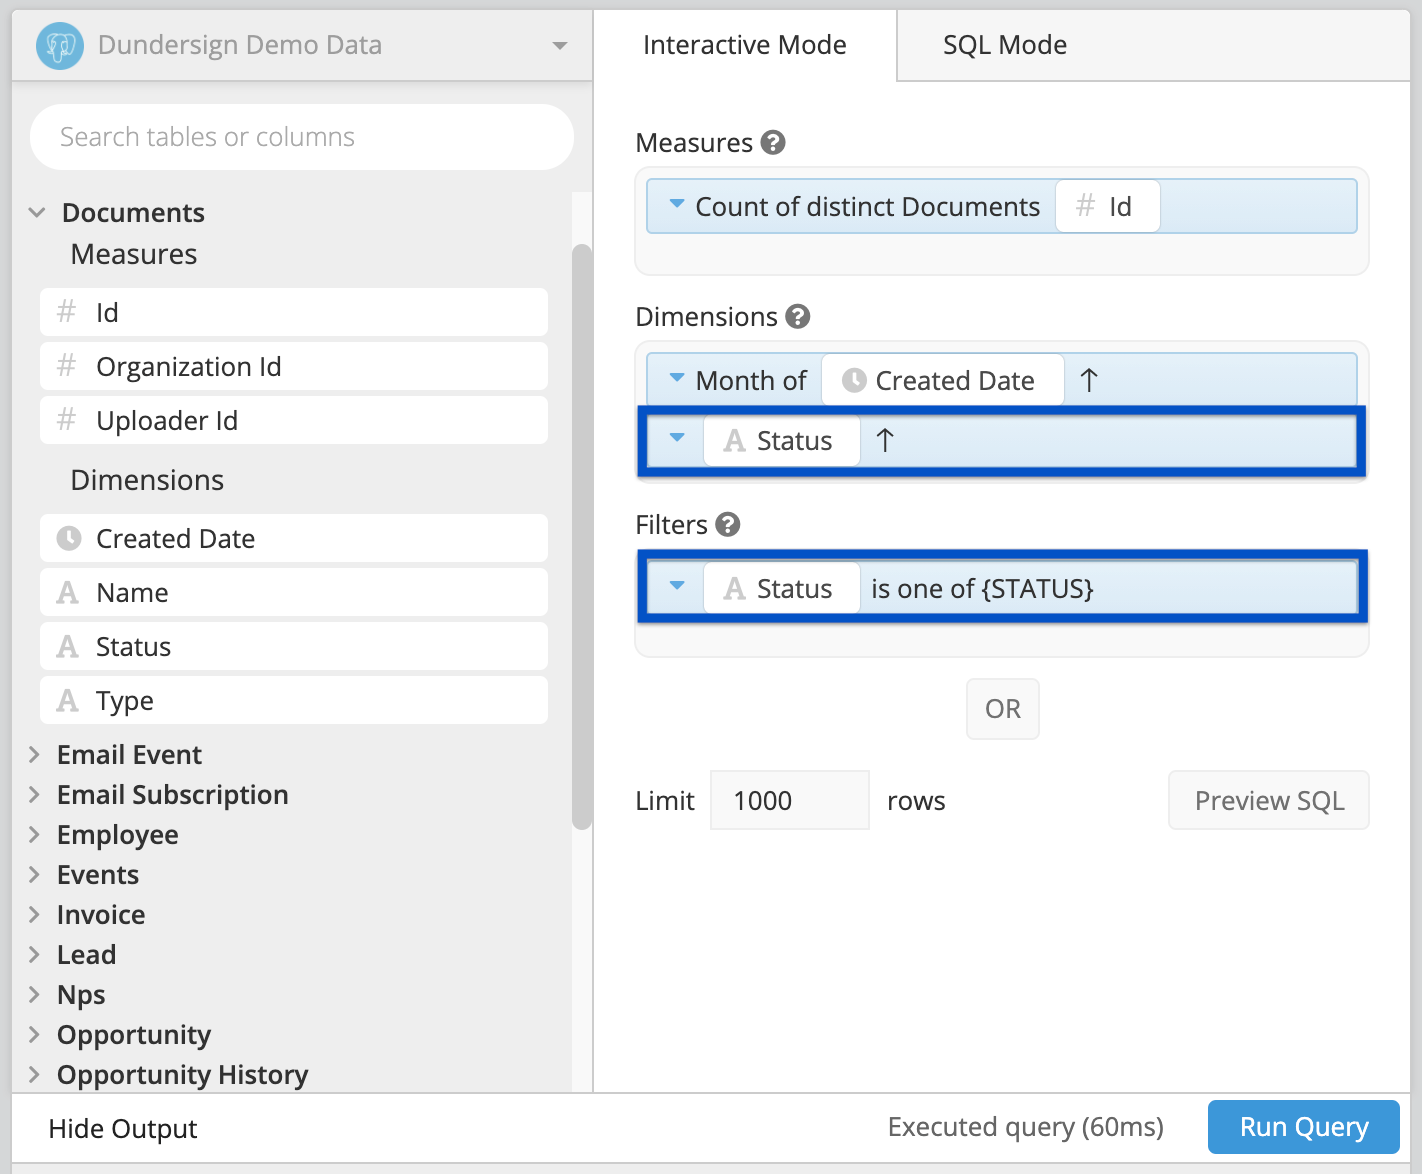
In our example, we make sure to add the “Status” column to the Dimensions of our query.
Note: You still need to connect the Dropdown in your Dataset to ensure your chart will still update when Dropdown values are selected.
Here’s how the Dataset looks for our example:
-
In Interactive Mode
-
In SQL Mode
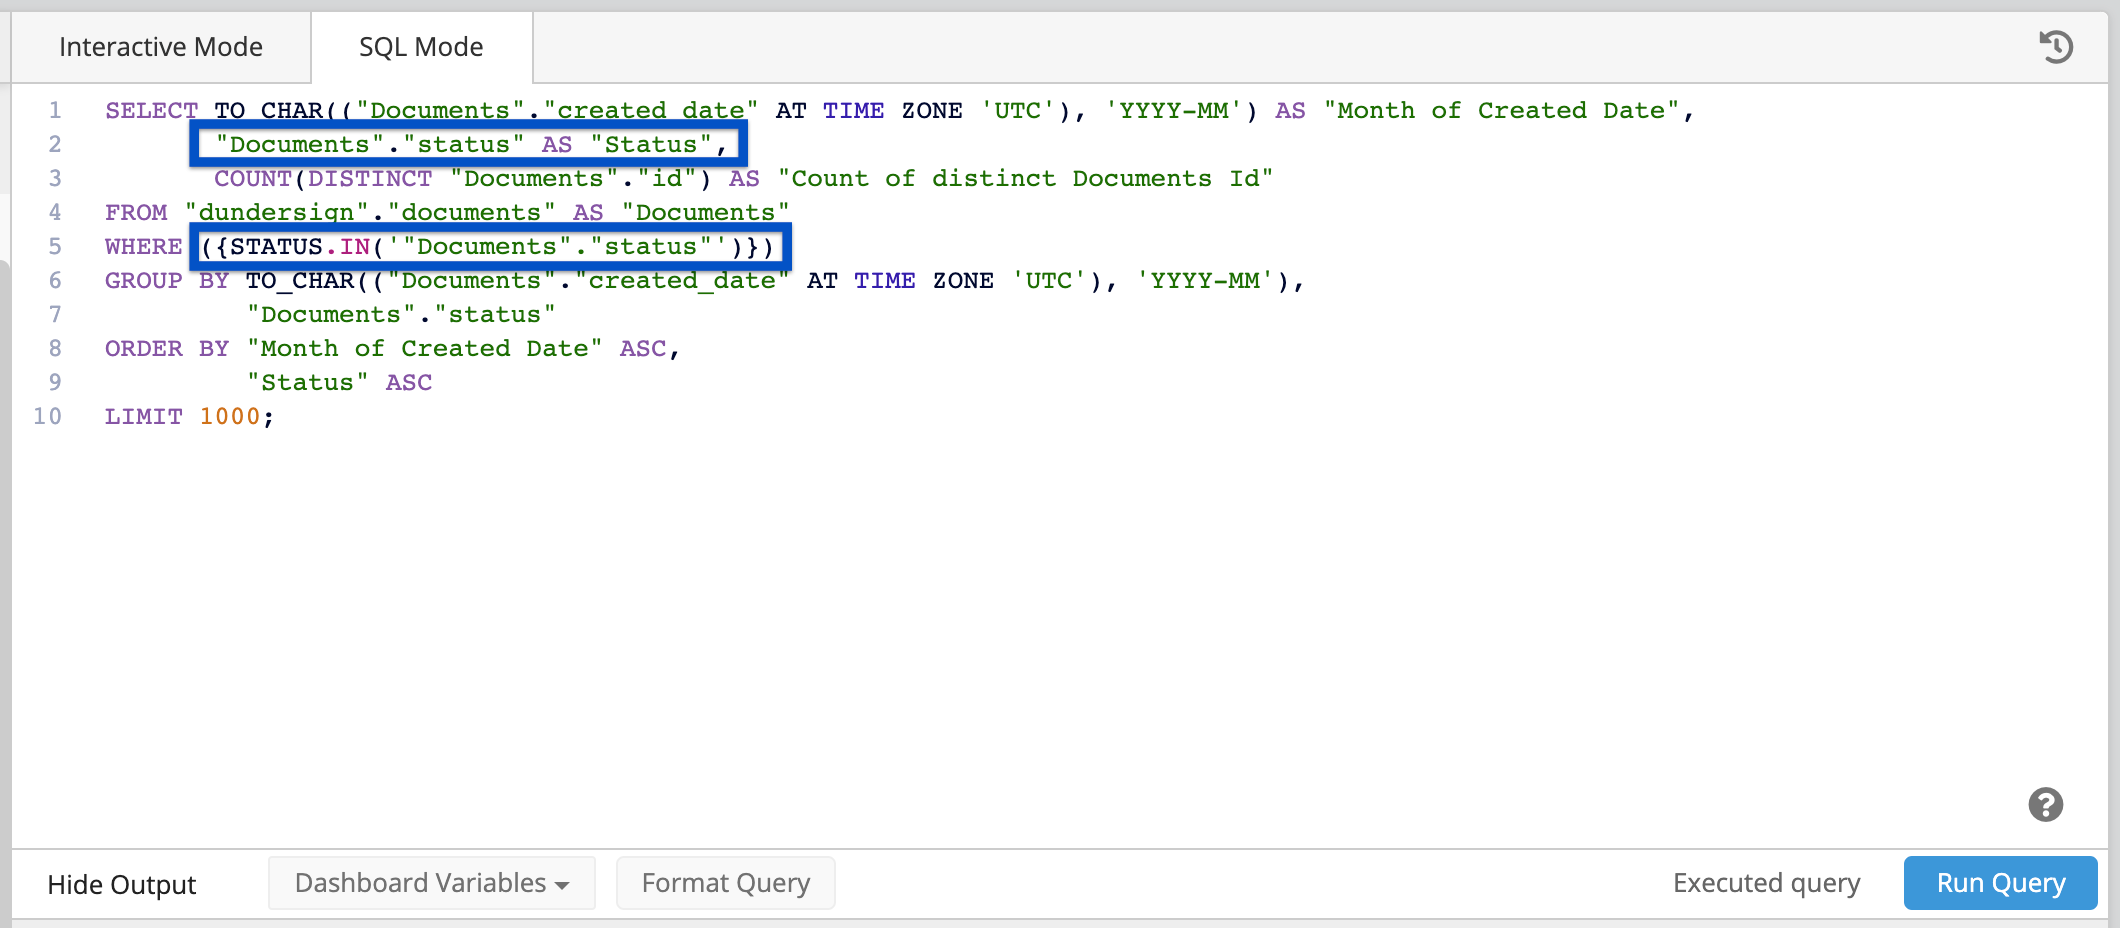
-
-
Click the + icon below the modified Dataset and add a Reorder Columns step below your modified Dataset to move the column used for filtering to the leftmost column of your result set.
-
Click the + icon to the left of the Datasets to create another a new Dataset that’s identical to the query used to create your Dropdown. Choose No, keep steps with first dataset if prompted. Click Run Query to execute it.
Tip! If you created your Dropdown in Interactive Mode, quickly “copy” your Dropdown’s SQL by editing your Dropdown, switch to SQL Mode, copy the generated SQL, and use it for this step.
-
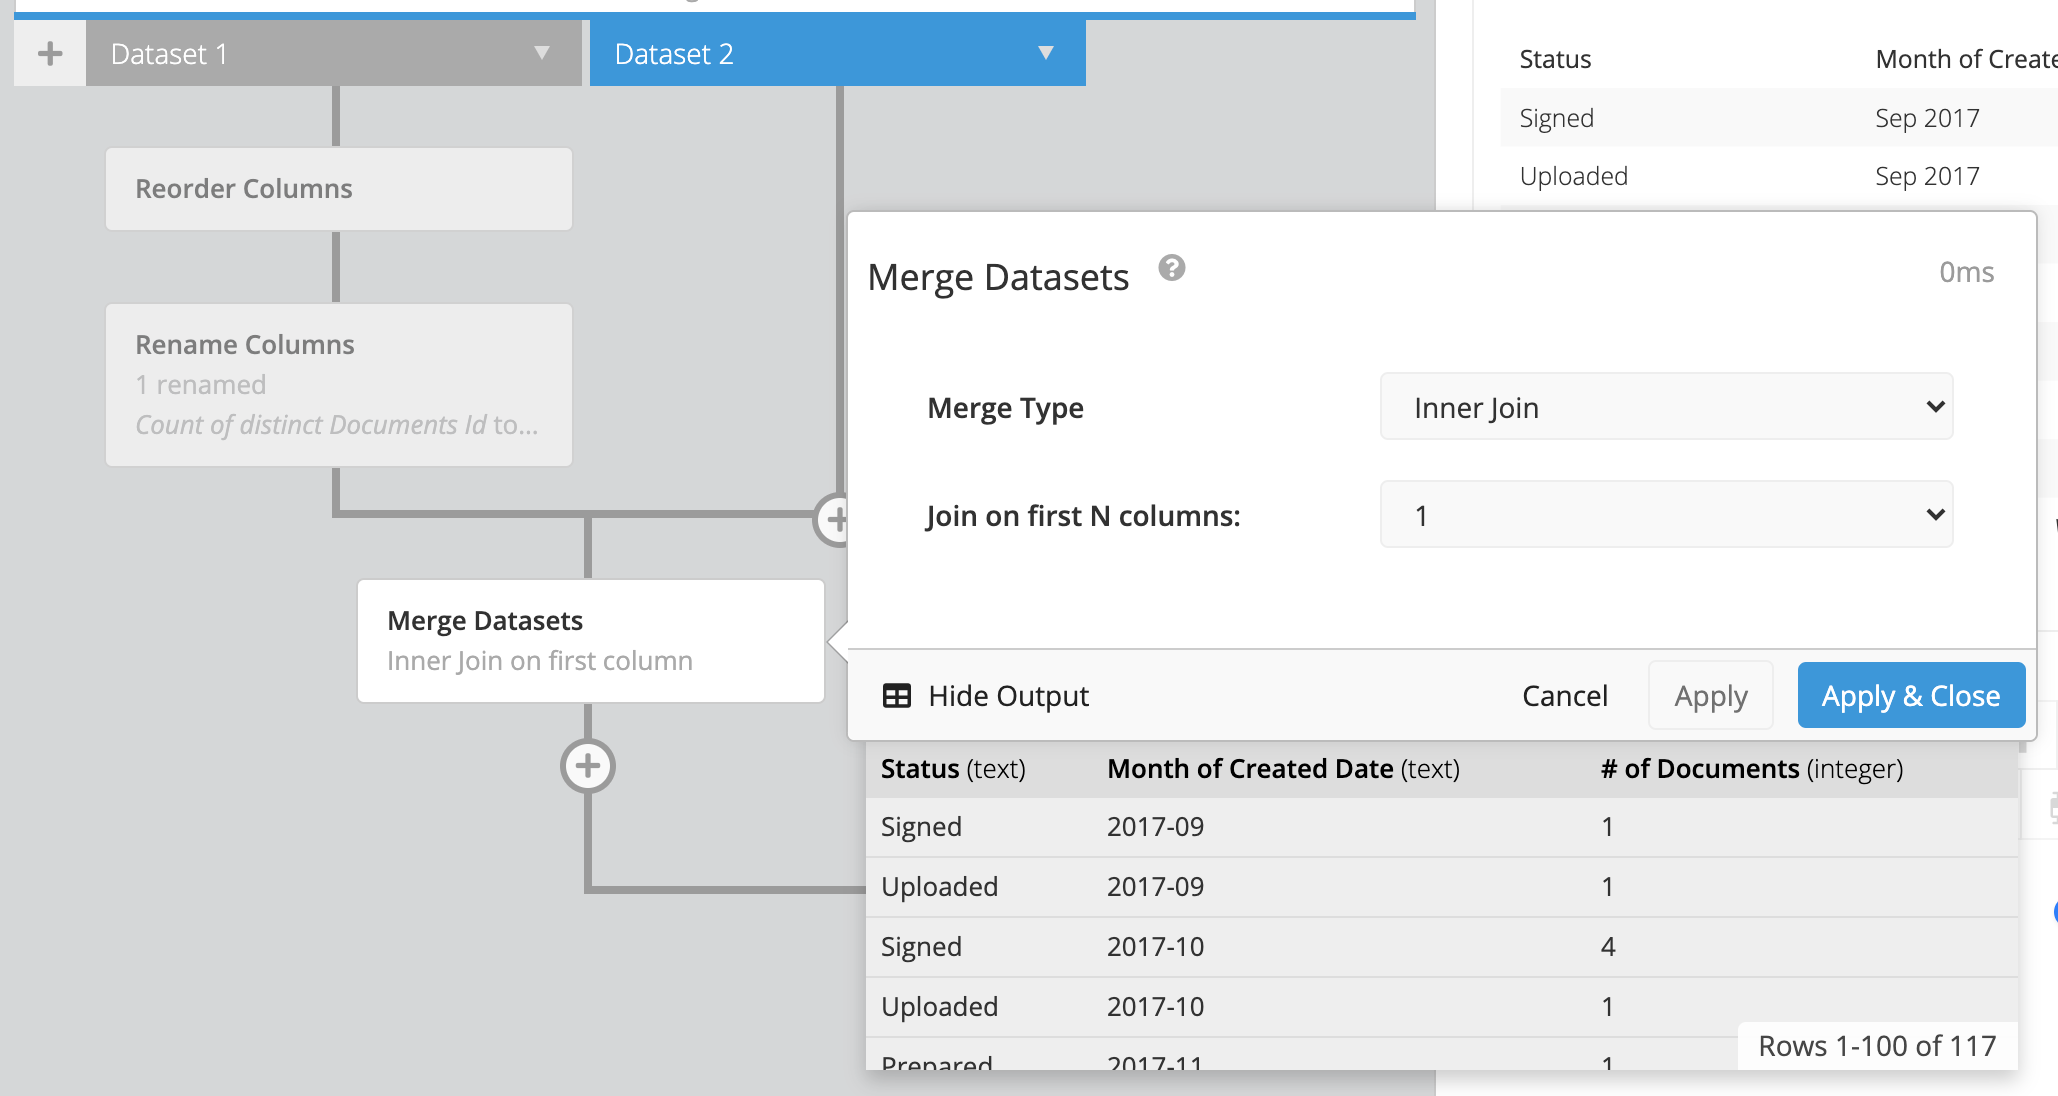
Click the Merge Datasets step in the Pipeline and change the Merge Type to Inner Join. Click Apply & Close. Now the results of the original Query are filtered to only show rows relevant to the values in your Dropdown!
-
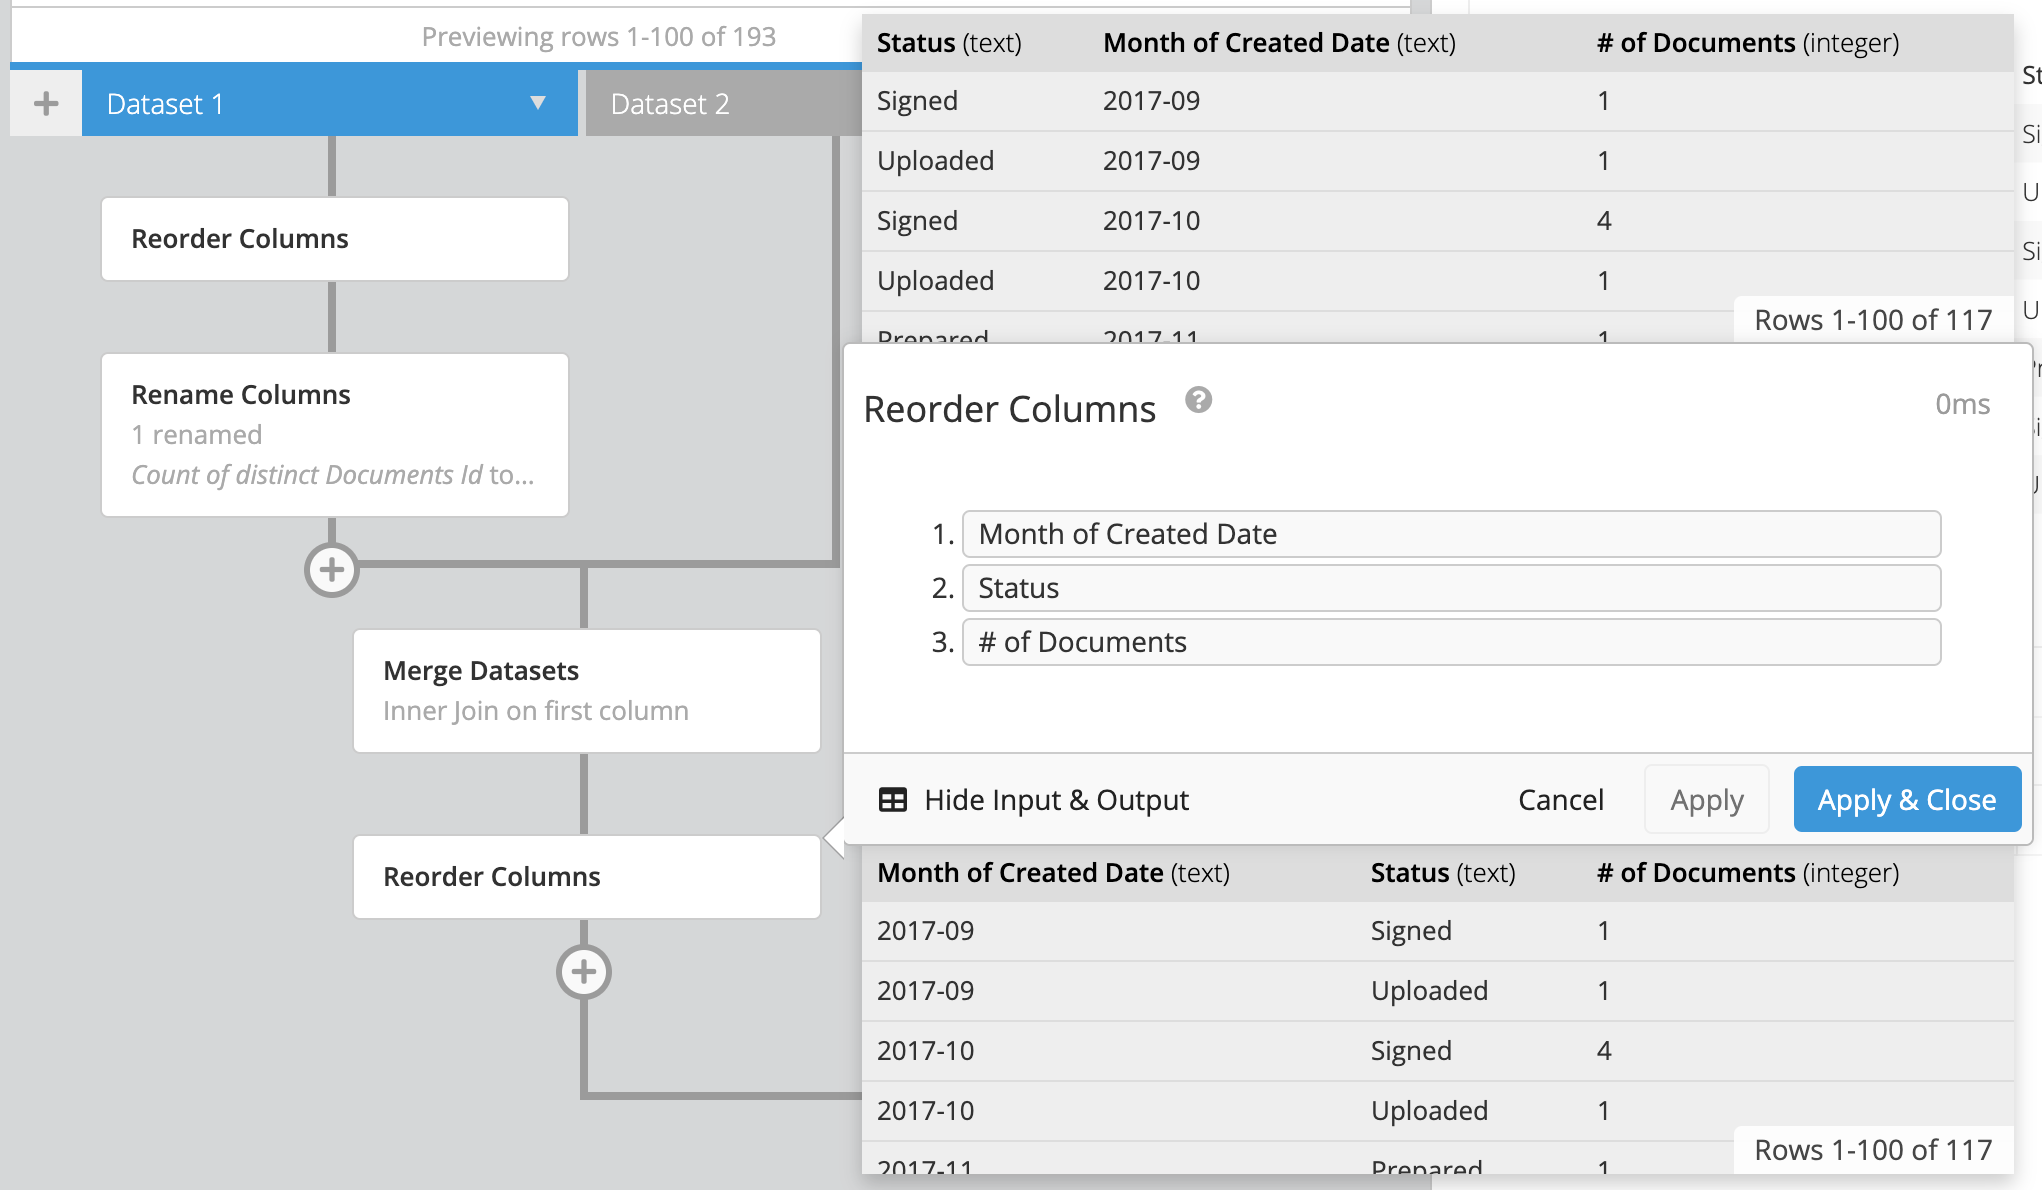
Reorder the filtered column back to its original position in your final result set—or hide it if it’s no longer necessary.
SQL Mode approach
The Pipeline approach may not be what you’re looking for if your query results would initially hit our maximum row limits. Instead, you can edit the SQL Mode query itself. You can also opt for this approach if your chart’s query was made with SQL Mode and you want to implement the solution in a single step!
In the WHERE clause of your chart’s query, you’ll need to add two conditions—the general format looks like this:
where "table_name"."column_name" IN (DROPDOWN_SQL) AND {DROPDOWN_NAME.IN('"table_name"."column_name"')}
-
For the first condition,
"column_name" IN (DROPDOWN_SQL), you need to copy the SQL query of your Dropdown and insert it into the WHERE clause of your chart’s SQL query. In other words, replaceDROPDOWN_SQLwith your Dropdown’s actual SQL.Tip! If your Dropdown was created in Visual Mode, simply switch to SQL Mode and copy the auto-generated SQL, excluding the trailing semicolon (
;) if there is one. -
The second condition,
{DROPDOWN_NAME.IN('"table_name"."column_name"')}, ensures that your chart is connected to your Dropdown and applies the correct filter when values are actually selected.
SQL Mode approach applied to our example
Dropdown’s SQL query
SELECT "Documents"."status" AS "Status"
FROM "dundersign"."documents" AS "Documents"
WHERE ("Documents"."status" NOT IN ('Canceled', 'Unsigned'))
GROUP BY "Documents"."status"
ORDER BY "Status" ASC;
Chart’s original SQL query
SELECT TO_CHAR(("Documents"."created_date" AT TIME ZONE 'UTC'), 'YYYY-MM') AS "Month of Created Date",
	"Documents"."status" AS "Status",
	COUNT(DISTINCT "Documents"."id") AS "Count of distinct Documents Id"
FROM "dundersign"."documents" AS "Documents"
WHERE {DROPDOWN_NAME.IN('"Documents"."status"')}
GROUP BY TO_CHAR(("Documents"."created_date" AT TIME ZONE 'UTC'), 'YYYY-MM'),
	"Documents"."status"
ORDER BY "Month of Created Date" ASC,
	"Status" ASC
LIMIT 100000;
Chart’s SQL query after inserting the Dropdown’s SQL query:
SELECT TO_CHAR(("Documents"."created_date" AT TIME ZONE 'UTC'), 'YYYY-MM') AS "Month of Created Date",
	"Documents"."status" AS "Status",
	COUNT(DISTINCT "Documents"."id") AS "Count of distinct Documents Id"
FROM "dundersign"."documents" AS "Documents"
WHERE "Documents"."status" IN (
	SELECT "Documents"."status" AS "Status"
	FROM "dundersign"."documents" AS "Documents"
	WHERE ("Documents"."status" NOT IN ('Canceled', 'Unsigned'))
	GROUP BY "Documents"."status"
	ORDER BY "Status" ASC
) AND {DROPDOWN_NAME.IN('"Documents"."status"')}
GROUP BY TO_CHAR(("Documents"."created_date" AT TIME ZONE 'UTC'), 'YYYY-MM'),
	"Documents"."status"
ORDER BY "Month of Created Date" ASC,
	"Status" ASC
LIMIT 100000;