Dashboard Settings
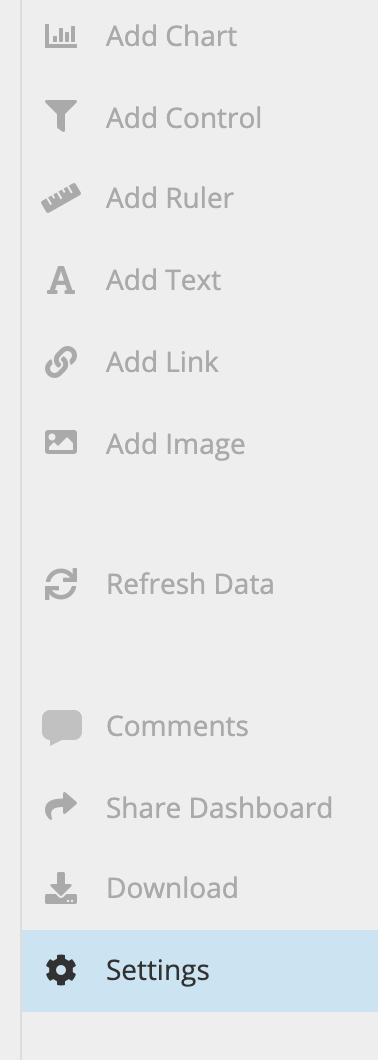
Access a dashboard’s settings by clicking the Settings button from the dashboard sidebar menu. To apply any changes to your dashboard settings, click Update at the bottom right of the Settings tab.
| Title | Slug | Theme |
| Time Zone | Cache Duration | Refresh Dashboard |
| Auto Apply Variables | Allow Viewers to Refresh Data | Category |
| Reports | Snapshots | Activity |
| Move to Trash | Archive |
Title
The dashboard title is displayed in the upper left corner of a dashboard.
Slug
The slug is displayed in the URL. If left blank it will be autogenerated from the category and title of the dashboard. If you update the title, the slug will not be affected.
Theme
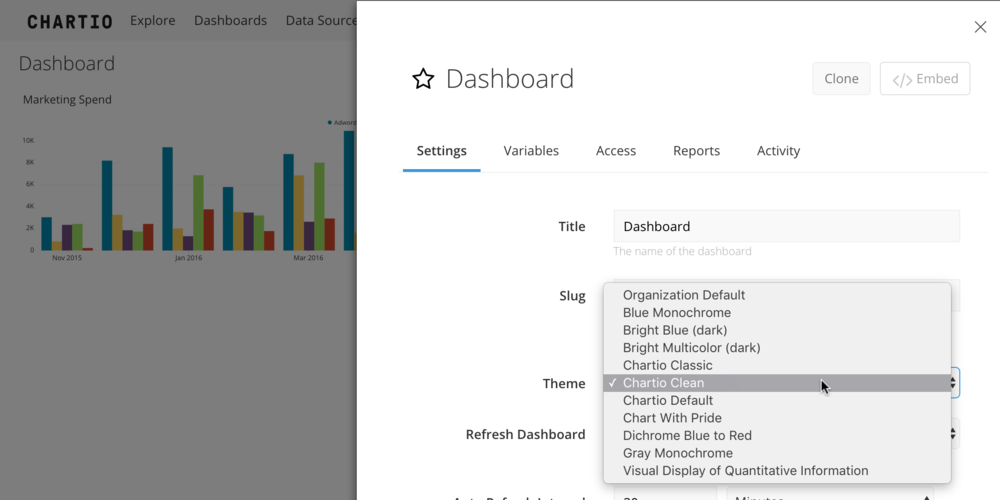
By default, the dashboard theme is your organization’s default theme. You can override organization’s default setting by choosing from your organization’s list of available dashboard themes. Click Update to apply your changes.
Don’t see a theme you like? Feel free to create your own!
Time Zone
See our Time Zone documentation.
Local Time Zone Override
Allows an individual dashboard to use the dashboard viewer’s local time zone instead of the dashboard’s set Time Zone.
Note: Local Time Zone Override is not available for embedded dashboards.

Cache Duration
Permissions required: Admin
Each chart is cached in our system from the first time the chart is created and saved. The Cache Duration tells Chartio how long to keep chart data before querying your database for fresh data according to the dashboard’s Refresh method. If you would like fresh data very often, you can set the cache duration to a lower time interval. The lowest a Cache Duration can go is two minutes, but this may severely impact your data source performance. On the other hand, if you’re worried about your data source performance, you can set the Cache Duration to a higher value to trigger queries less frequently.
Your organization’s default cache duration is set for all dashboards in your instance from the Settings tab in the top navigation bar. When Use Organization Default is selected in a dashboard’s settings, the cache settings will use the organization default.
New queries to update your dashboard’s cache are only sent to your database when one of the following occurs:
- a dashboard is opened and is being viewed (depending on the Refresh method set);
- a dashboard Report or Snapshot is being generated;
- the cache is expired and a user refreshes the dashboard;
- a user modifies a chart’s query and re-runs the query;
- a user manually refreshes the dashboard;
- a user manually refreshes a chart.
If none of these criteria are met, new queries are NOT sent from your dashboard to your database.
Refresh Dashboard
Refresh Dashboard refers to how often a dashboard will check whether its charts are displaying an expired cache version. Depending on the refresh method selected, the dashboard will update the charts with whatever exists in the cache at that point. If there are no existing results in the cache, or the cache is expired, then the chart’s queries will be executed against the data source(s) and the chart’s cache will be updated.
Refresh methods
Note: Whether or not you get fresh data when your dashboard refreshes is also dependent on your dashboard cache duration.
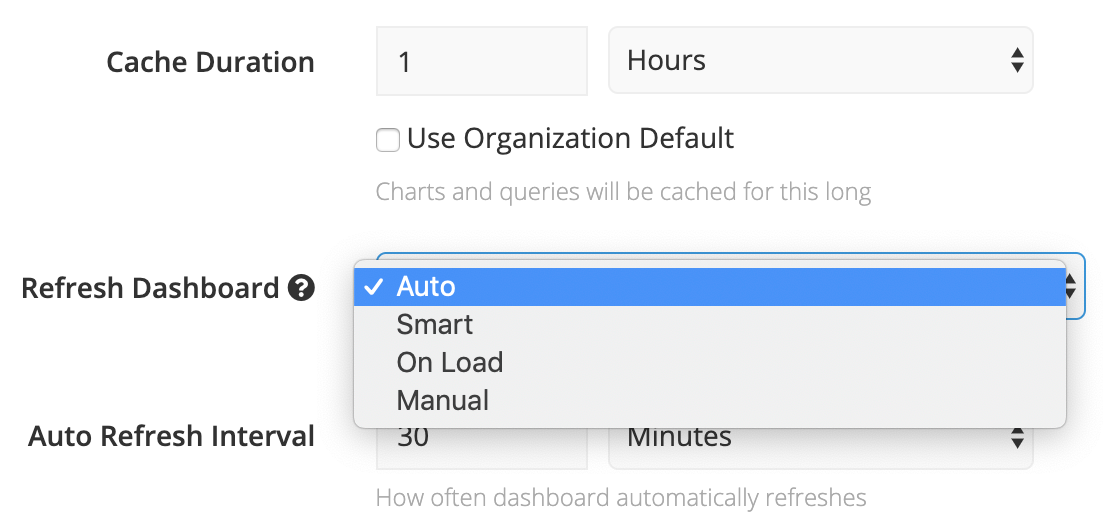
- Auto
While your dashboard is open, your charts automatically refresh at the Auto Refresh Interval you set. - Smart
Similar to the Auto refresh method, your charts automatically refresh at the Auto Refresh Interval you set–but only while the dashboard is being viewed. In other words, new queries won’t be triggered if the dashboard is open but in an inactive (i.e., not currently in view) browser tab. - On Load
Your charts load with fresh data when the dashboard is first opened but won’t refresh again unless manually refreshed. - Manual
Your charts won’t refresh until a chart refresh is manually triggered.
Manually refreshing data
Note: Manually refreshing chart data overrides your dashboard’s cache duration.
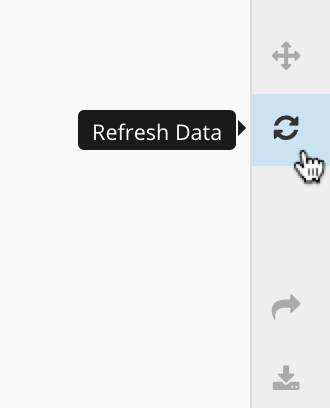
To manually refresh all the charts on your Dashboard, click Refresh Data from the dashboard sidebar. This sends new queries if the cached chart data is more than 2 minutes old.
To manually refresh a chart’s data, hover over the chart, open its ellipsis menu and click Refresh Chart Data.
Modifying a chart’s query and re-running the query also manually refreshes the chart data!

Auto Apply Variables
By default, your charts update whenever any Dashboard Control value changes. If you’d instead like to update multiple Controls and apply the changes all at once to send a single new query, you can deselect Auto Apply Variables in your dashboard settings.

When Auto Apply Variables is deselected, you’ll see an Apply Filters button in the upper right of your dashboard whenever you make any Control changes. Once you’re finished updating your Control values, click this button to apply the Control changes to your charts.

This setting is beneficial for dashboard performance because it prevents new chart queries from triggering every time you make a Control selection, for example in a multi-select dropdown.
Allow Viewers to Refresh Data
This toggle controls whether users with view-only access to the dashboard can refresh the data for charts on the dashboard.
Category
Assign the dashboard to an existing category or create a new category by typing the name of the category in the text box. If the category does not already exist, it will be created. Remember you can make use of nested categories too!
You can reassign a dashboard to a different category by updating the category field. Note: The slug will not automatically be updated to reflect the change of category.
Reports Enabled
If you would like to create scheduled email reports from this dashboard, make sure the Reports Enabled checkbox is checked.
Snapshots Enabled
To set up Snapshots for the dashboard, select Snapshots Enabled from the dashboard’s settings.
Activity
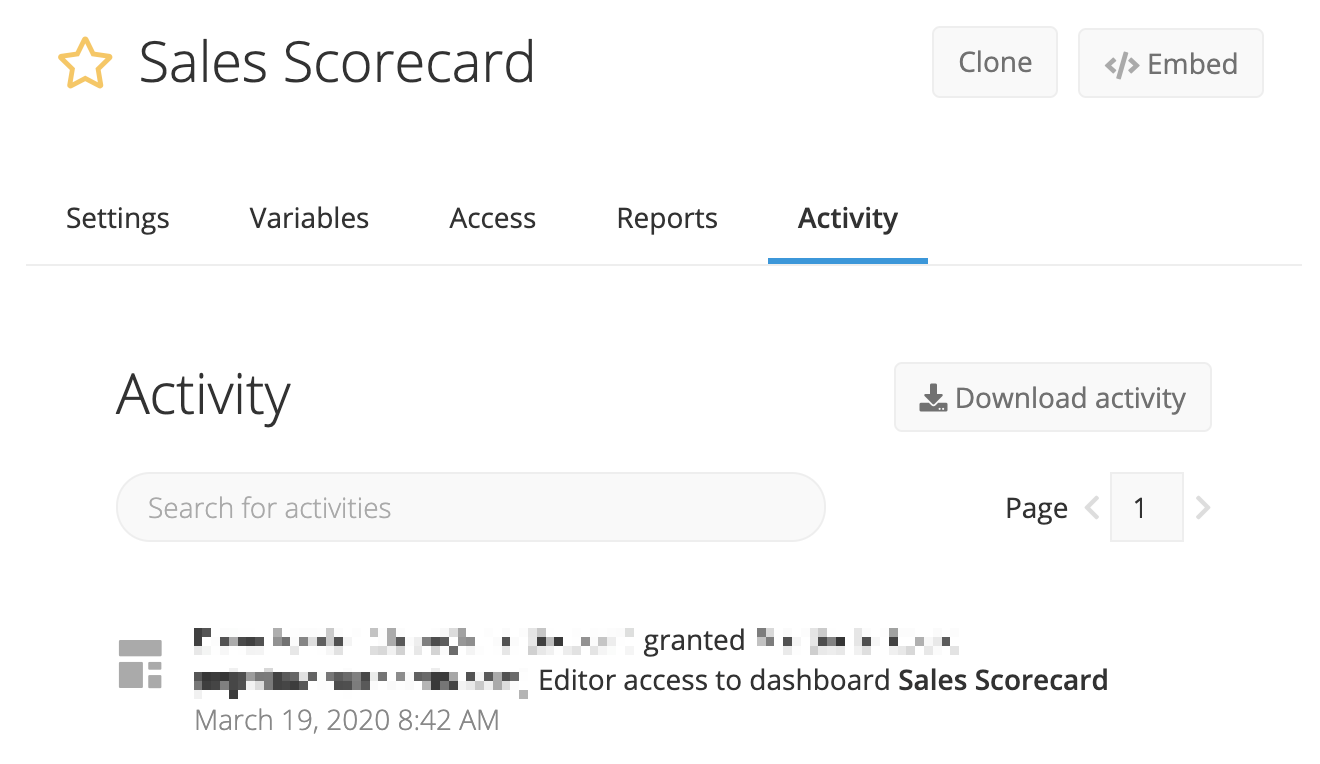
Navigate to the Activity tab of your dashboard settings to see actions performed by users with access to the dashboard from up to one year ago. Types of actions include the creation, updating, or deletion of charts and Dashboard Controls, changes to access permissions, etc.
You can also download a CSV of this dashboard activity by clicking Download Activity.
Move to Trash
Delete the dashboard by clicking Move to Trash. Refer to our Manage Dashboards page for more information on deleting a dashboard and restoring deleted dashboards.
Archive
Archive a dashboard by clicking Archive. Refer to our Manage Dashboards page for more information on archiving a dashboard.