Search charts by table query usage
For query and data source tuning purposes you may want to find out which charts on which dashboards are sending queries to certain data source tables.
You can do this in Chartio. Using the Chartio Query Log provided in the data source screen, you can download the query log from a given time period, save it as a CSV locally on your computer or as a Google Sheet in your google drive if you wish, and then upload it back to Chartio as a data source and build diagnostic queries on the CSV or Google Sheet to determine load times and data source pain points.
-
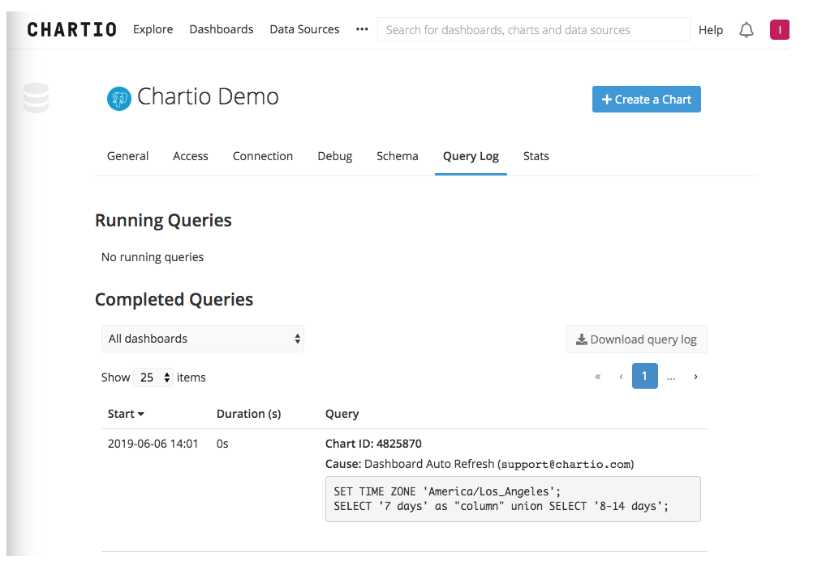
Extract the query log: To do this, click Data from the top navigation bar and choose a data source by clicking on it. Under the Query Log tab, click Download query log. This will download the query log as a CSV file that has many fields in it, including dashboard_id, slug, chart_id, duration, and query_sql.

- Upload the query log as a Data Source: Chartio supports CSV files, so just upload this CSV file back into Chartio as its own CSV data source.
-
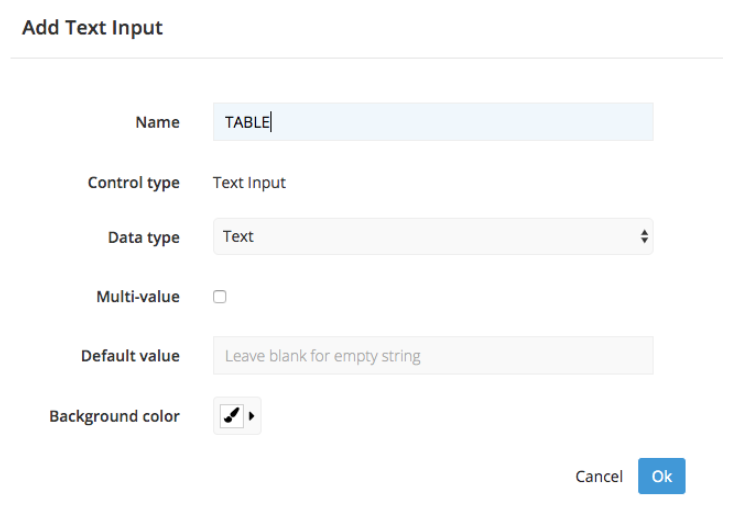
Create a new dashboard and add a Text Input: Once you created a dashboard, click Add Control from the right side menu and choose Text Input. Fill out the control fields to match the example below. Click Ok when done and place your Text Input on your dashboard.
This will be the search box for Table lookups.

-
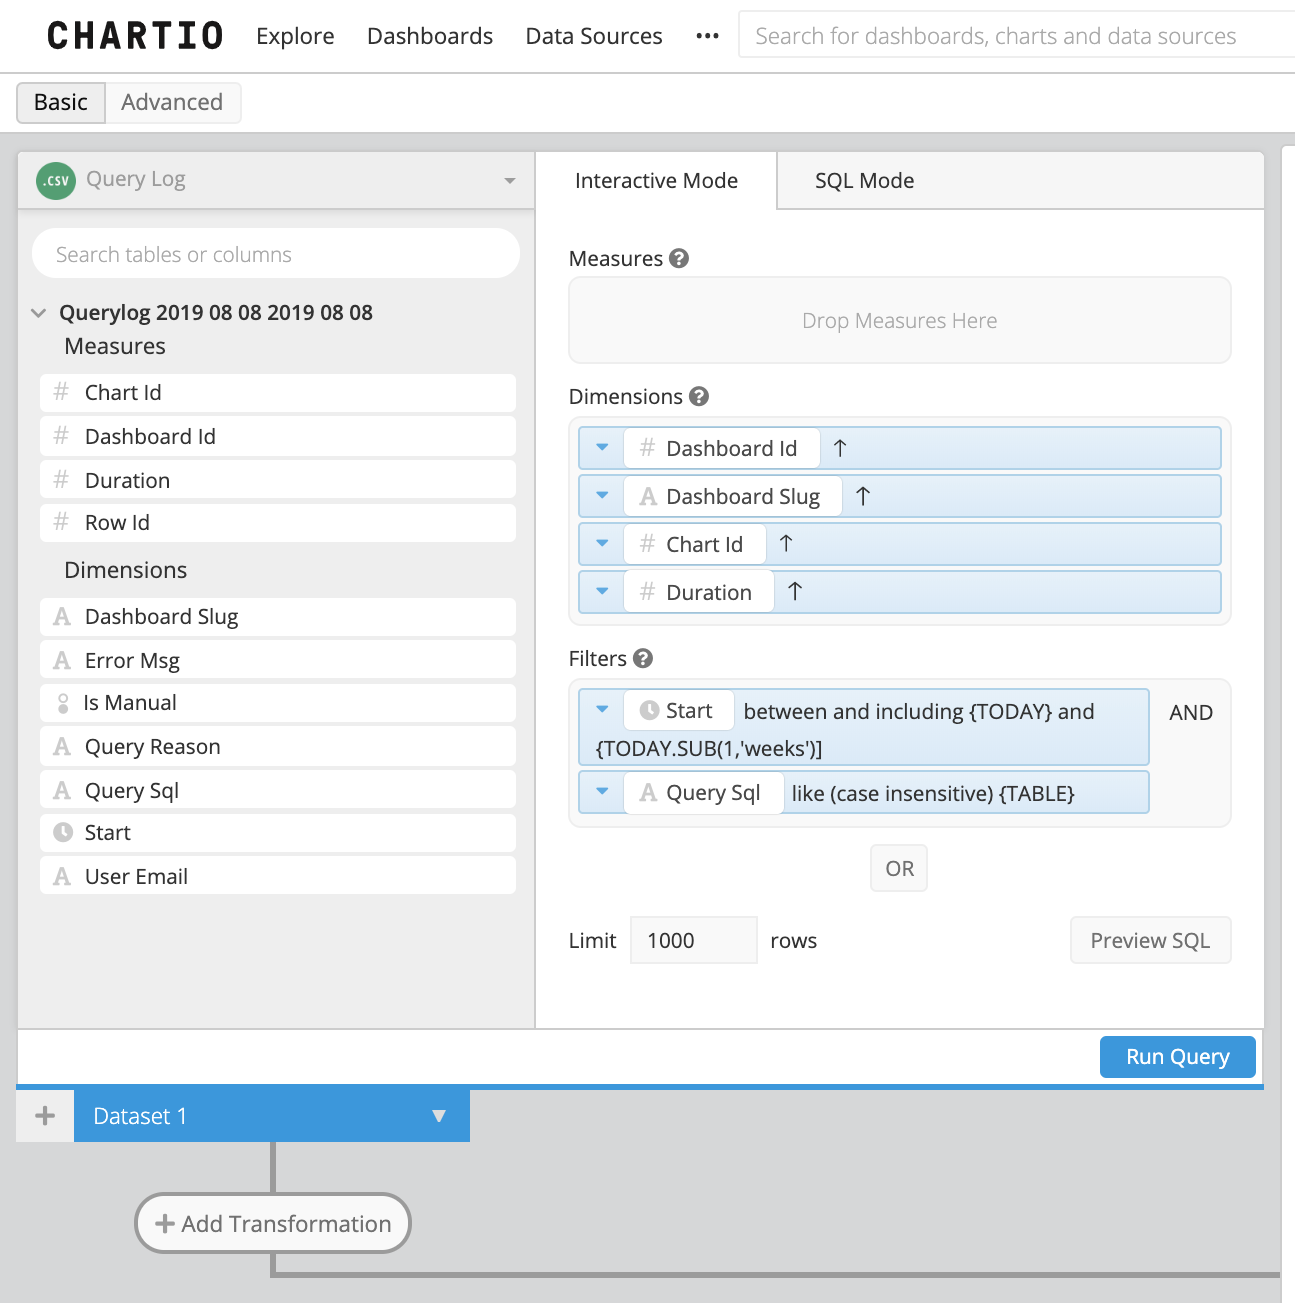
Create a usage Table: On your dashboard, click Add Chart from the right side menu. Select your Query Log CSV as the data source and add the fields selected in the screenshot below.
This table’s output will link to charts which query against the table selected in the TABLE Text Input we just made.

-
Create a chart URL column: In the Pipeline, click the + Add Transformation button and choose Add Column. Title the new column something like “Chart Link” or “Chart URL” to assign a new column name. Using a Custom formula, type in the formula below, replacing YOURORG_SLUG with your organization’s Chartio URL:
"https://chartio.com/YOURORG_SLUG/" || "Dashboard Slug" || "/chart/" || "Chart Id" || "/" - Saving the table, you can now search the SQL. Note: For “like” filters, use % around the search. With small modifications, this dashboard could point out long-running queries and let you investigate problematic queries.
Which charts are querying my data source table?
If you are interested in seeing which charts or data stores are querying a specific table in your data source, please email support@chartio.com and we can provide you with the report.
Interested in a more scalable solution?
The Query Log data source option is available with the Organization plan. With this option, you can query a live query log data source containing performance information on all the data sources you’ve connected to Chartio.
You can perform analysis on your instance to determine highly used dashboards as well as identify slow running or problematic queries.
If you’re interested in upgrading your account, please reach out to support@chartio.com.