Create a dependent Dropdown
When creating a Dropdown to filter your charts, you may run into a situation where your Control contains too many results to be useful or easily searchable. To narrow down your available results depending on a certain condition, you can easily create a dependent Dropdown. You’ll essentially filter a Dropdown using another Dropdown.
In this example, we used our Dundersign Demo Data data source to create a Table listing out our customers and each customer’s MRR. We want to filter our Table by company, but this company list is extensive as we have multiple customers from various states. We’d like to only look at companies from selected states to compare them in our Table.
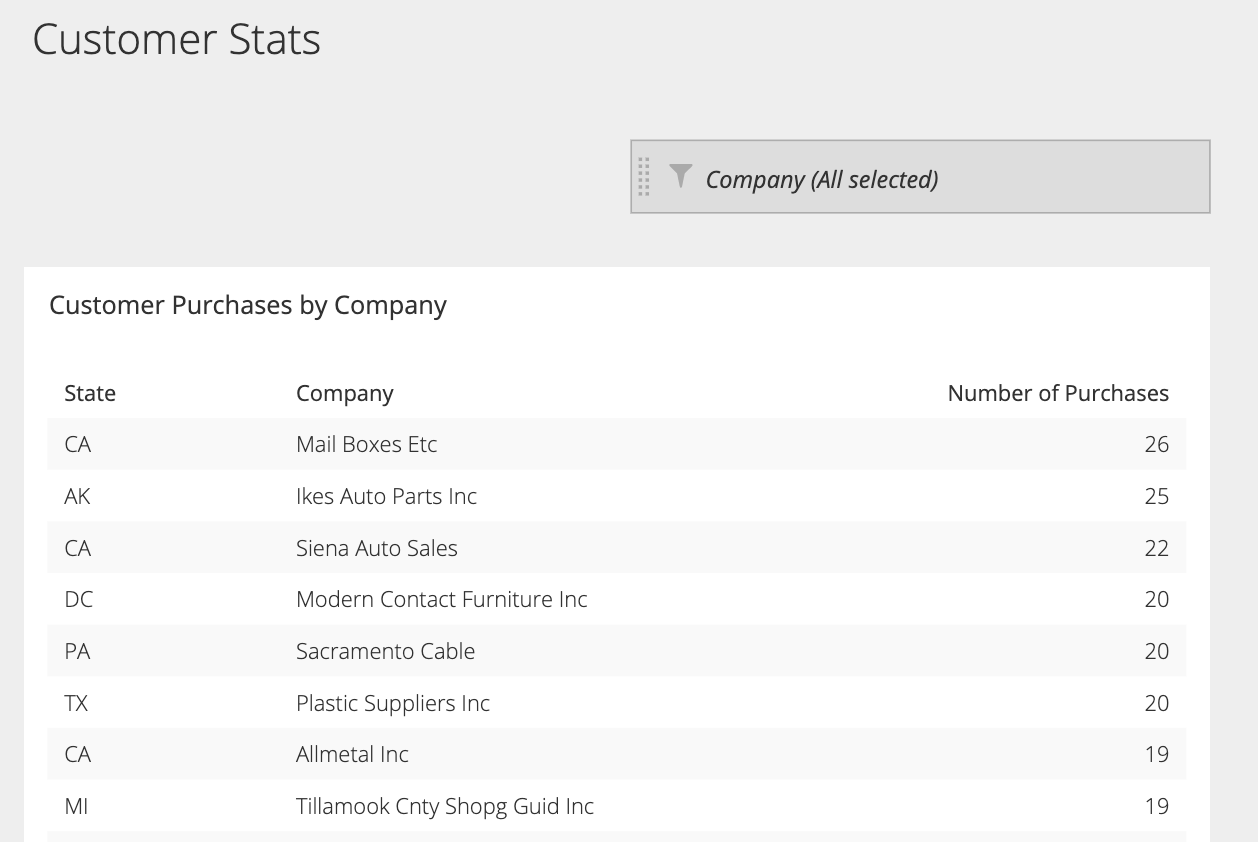
To do this, you’ll need to create two Dropdowns, one with the initial broader categories (State) and a second with the results you want filtered (Company).
In the Visual SQL interface
1. Create the initial Dropdown
- From your dashboard’s right-side menu, click on Add Control > Dropdown.
- Add the Name column from the Organizations table to the Columns section and use the Group aggregation in the Result Table.
- Name the Control
COMPANYand fill out the Control’s options under the preview on the right side of the Editor. In this case, we opted to use the Multi-select option to be able to select multiple companies and compare them in our chart. We also chose the Show All Empty state and deselected Initial value(s). - Click Save to Dashboard when you’re ready to place your new Dropdown on your dashboard.
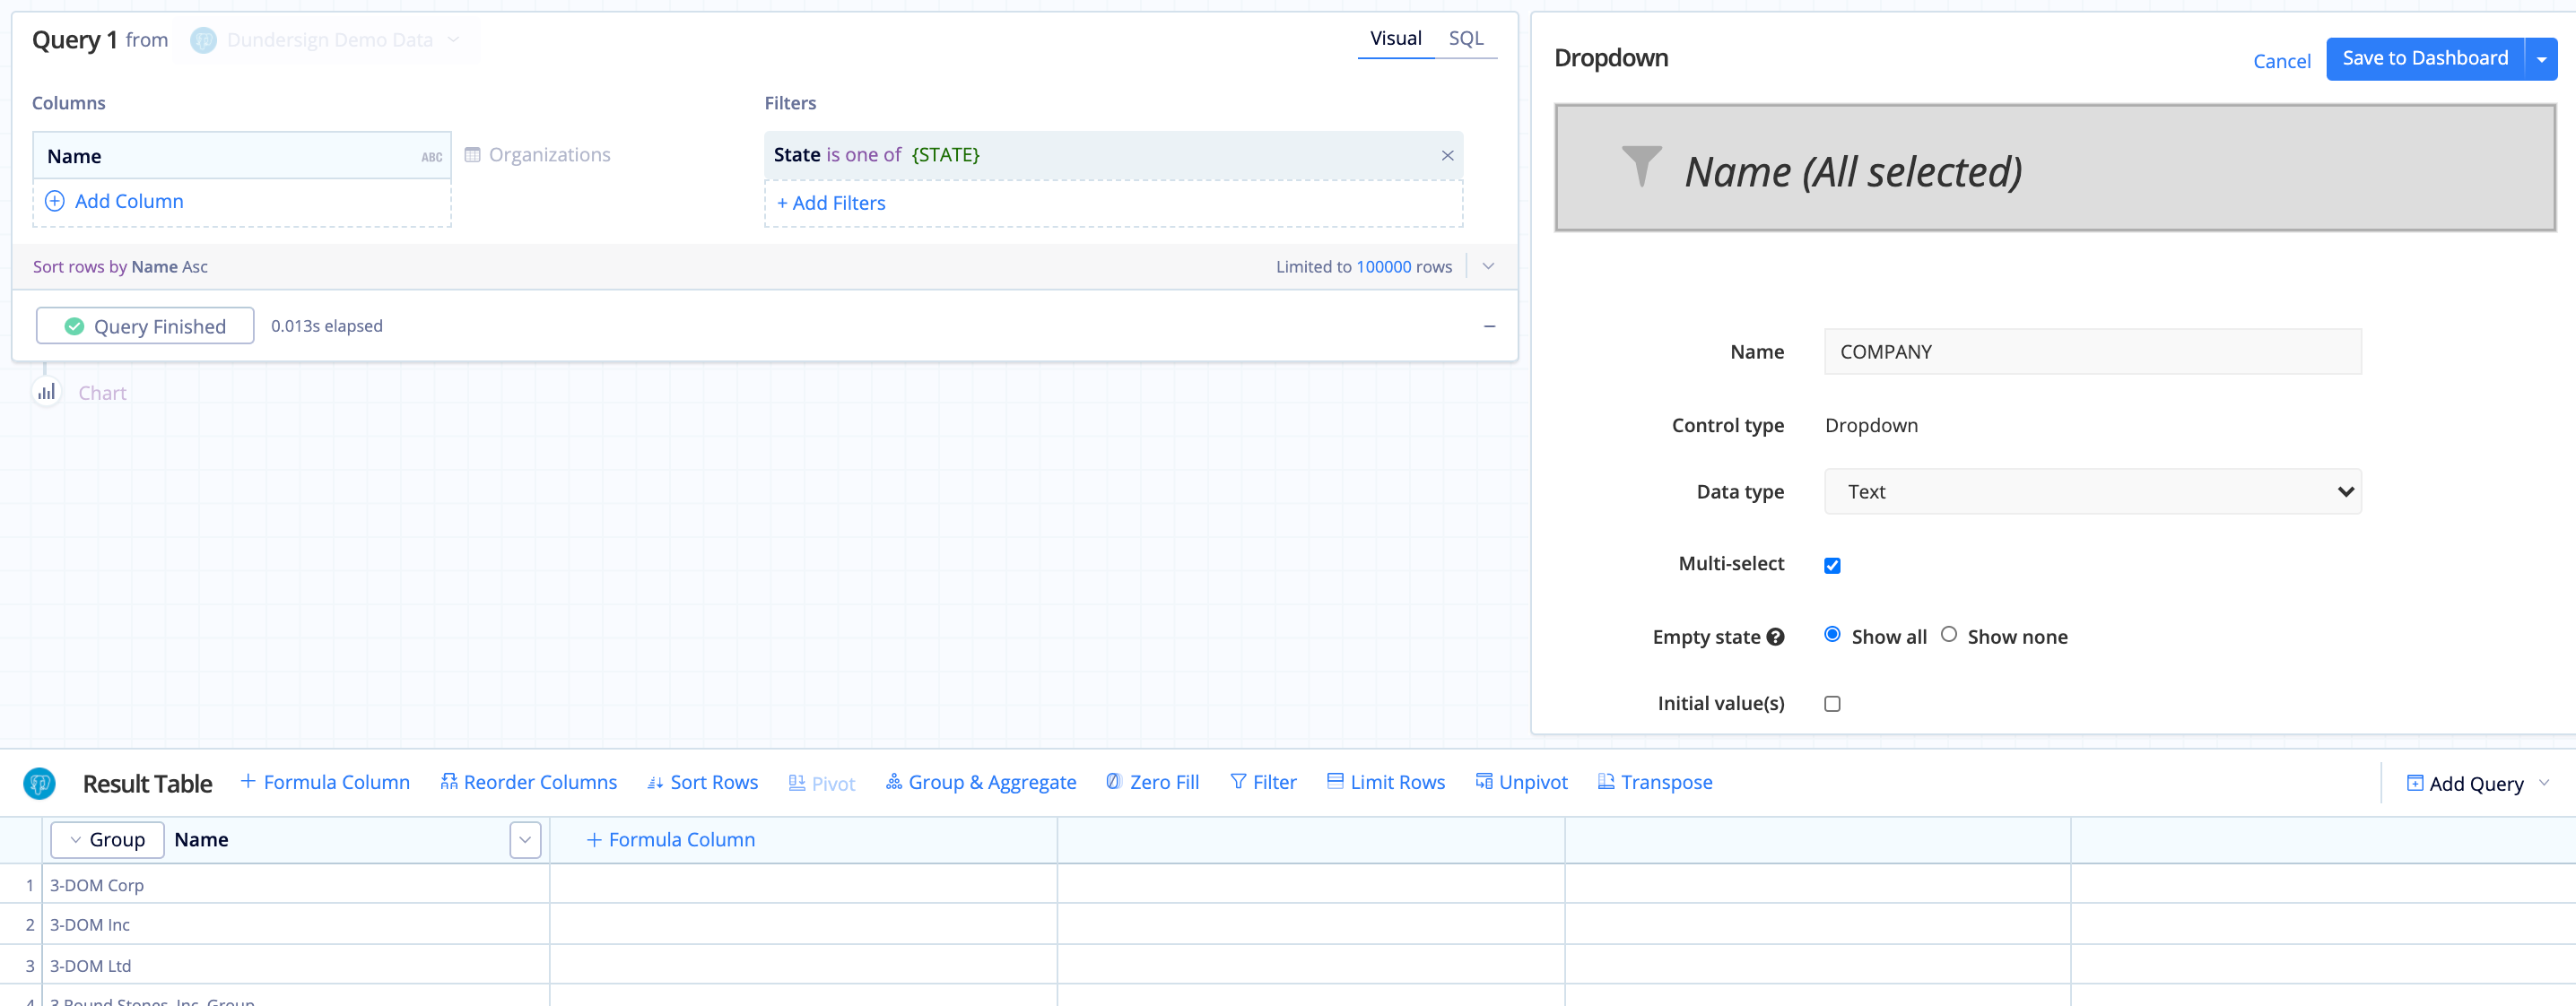
2. Connect your Dropdown to your chart
- Open Visual SQL by clicking Edit Chart Data from the chart’s ellipsis menu.
- Add the Name column to the Filters section, select the is one of filter operator, and select
{COMPANY}for the filter value. - Click Run Query.
- Click Save to Dashboard to save your changes.
Your chart is now set up to filter using the Company Dropdown. To filter the Company Dropdown itself, we’ll need to create another Dropdown with the customers’ states.
3. Create another Dropdown
The steps are basically the same as creating the Company Dropdown, but this time you’ll want to pull in the customers’ states by adding the State column from the Organizations table to the Columns section.
Name this Dropdown STATE, select Multi-select, choose Show All for the Empty state, and deselect Initial value(s). When you’re done changing the settings, click Save to Dashboard to place your second Dropdown on your dashboard.
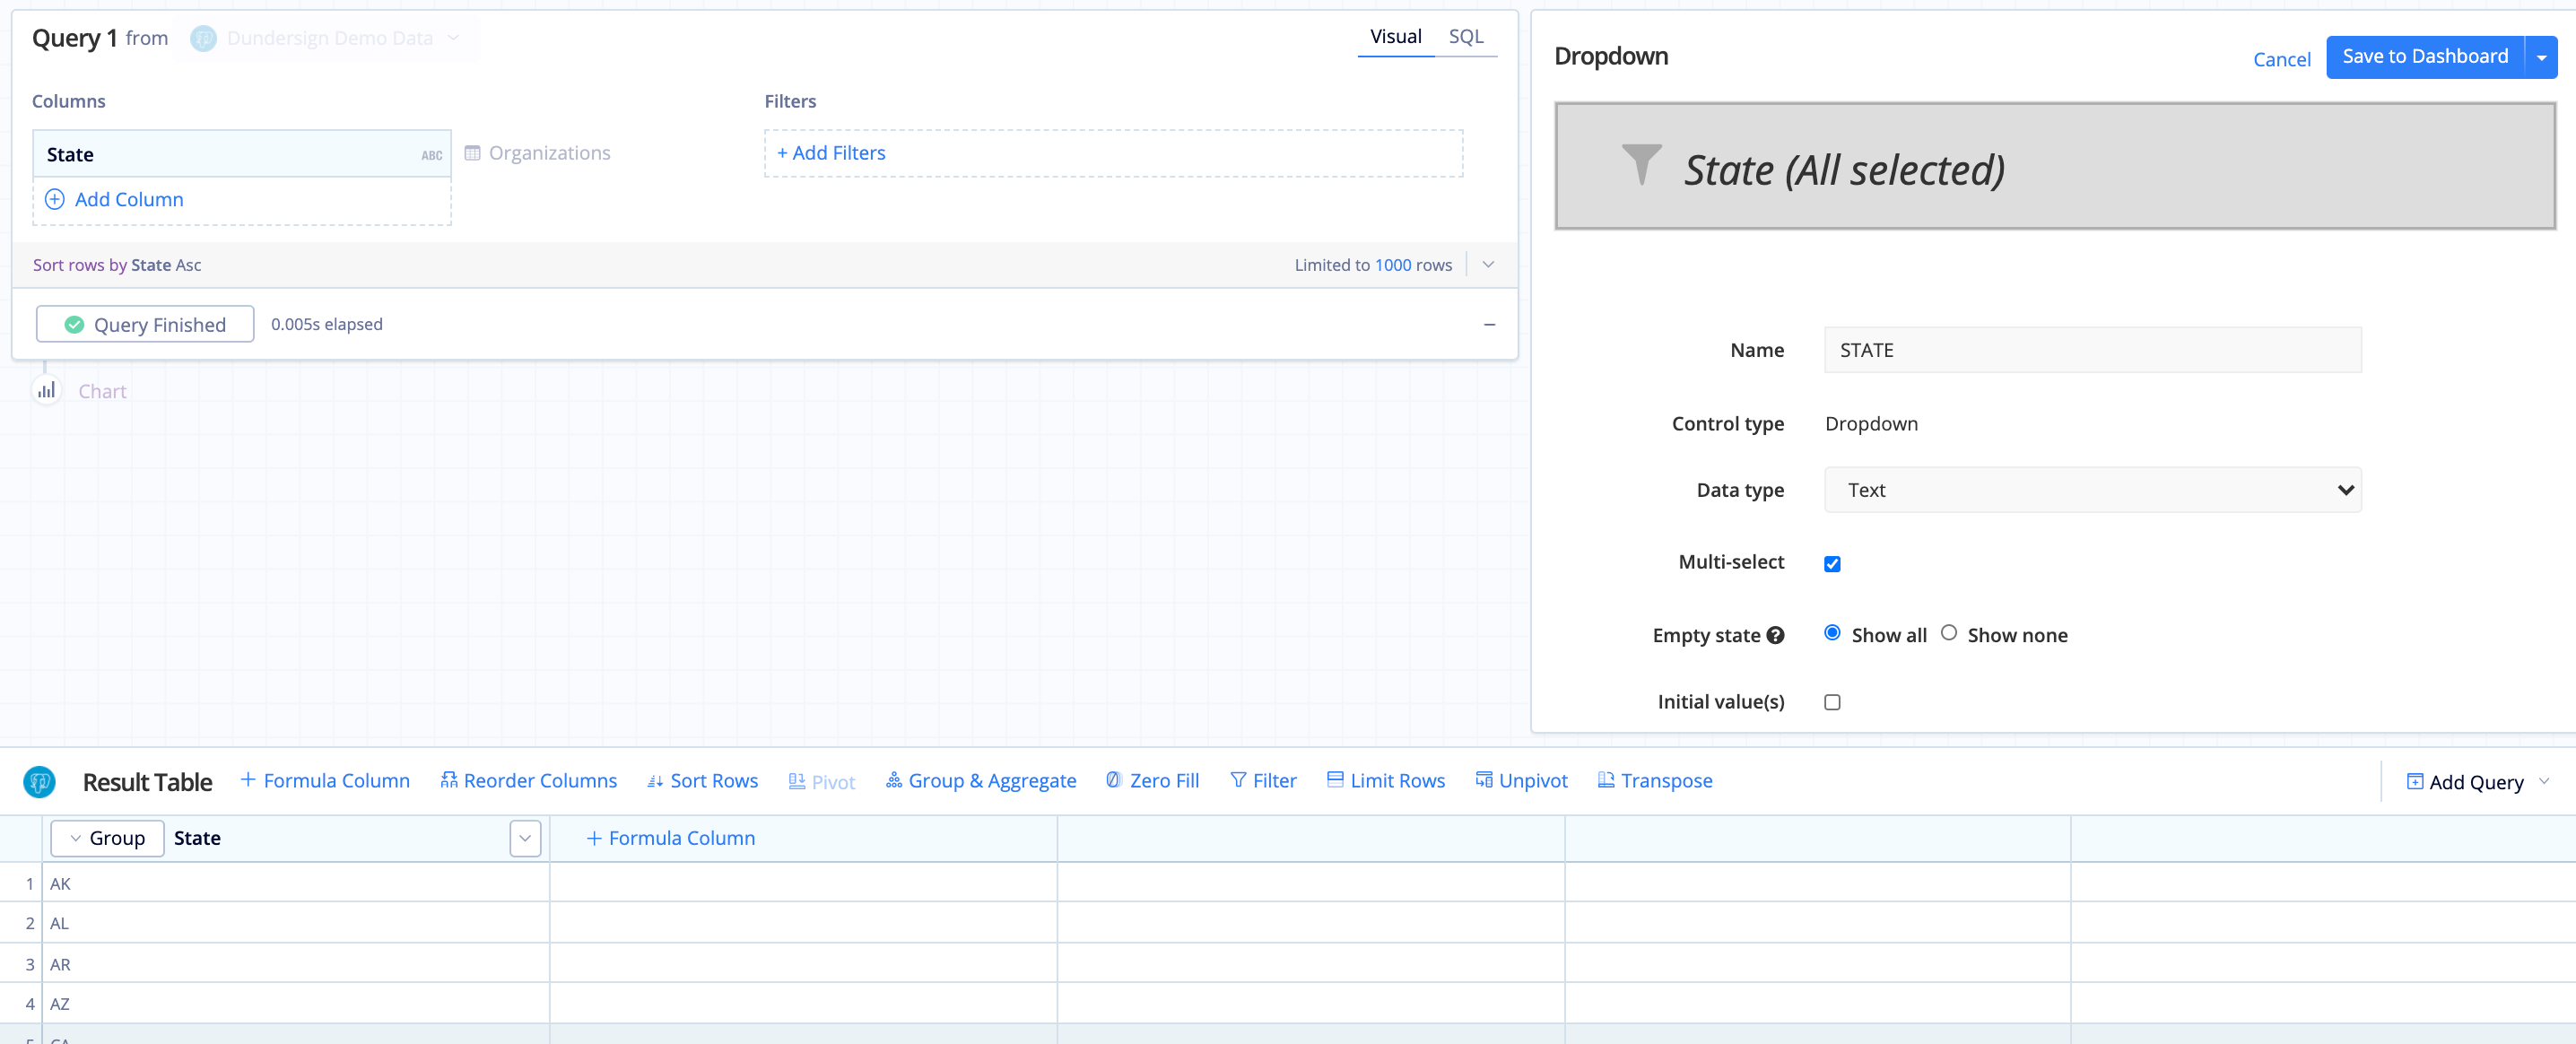
4. Use the new Dropdown to filter your initial Dropdown
To help narrow down the long list of companies in the Company Dropdown, add the State Dropdown to the Filters of the Company Dropdown.
- Edit the
COMPANYDropdown by opening its ellipsis menu and clicking Edit Filter. - Add the State column to the Filters section, select the is one of filter operator, and select
{STATE}for the filter value.
And there you have it. You can now make a selection for the State Dropdown to get a refined customer list in the Company Dropdown to better filter your Table.
This concept of dependency between Dashboard Controls can be applied in various ways, so don’t hesitate to play around with the different Controls and Variables to customize your dashboard. For instance, try using a Text Input instead of the first Dropdown to manually enter filter options.
In the Data Explorer interface
Check out the video below going over setting up a dependent Dropdown:
1. Create the initial Dropdown
- From your dashboard’s right-side menu, click on Add Control > Dropdown.
- Add the Name column from the Organizations table to the Dimensions field.
- Name the Control
COMPANYand fill out the Control’s options under the preview on the right side of the Editor. In this case, we opted to use the Multi-select option to be able to select multiple companies and compare them in our chart. We also chose the Show All Empty state and deselected Initial value(s). -
Click Save Chart when you’re ready to place your new Dropdown on your dashboard.
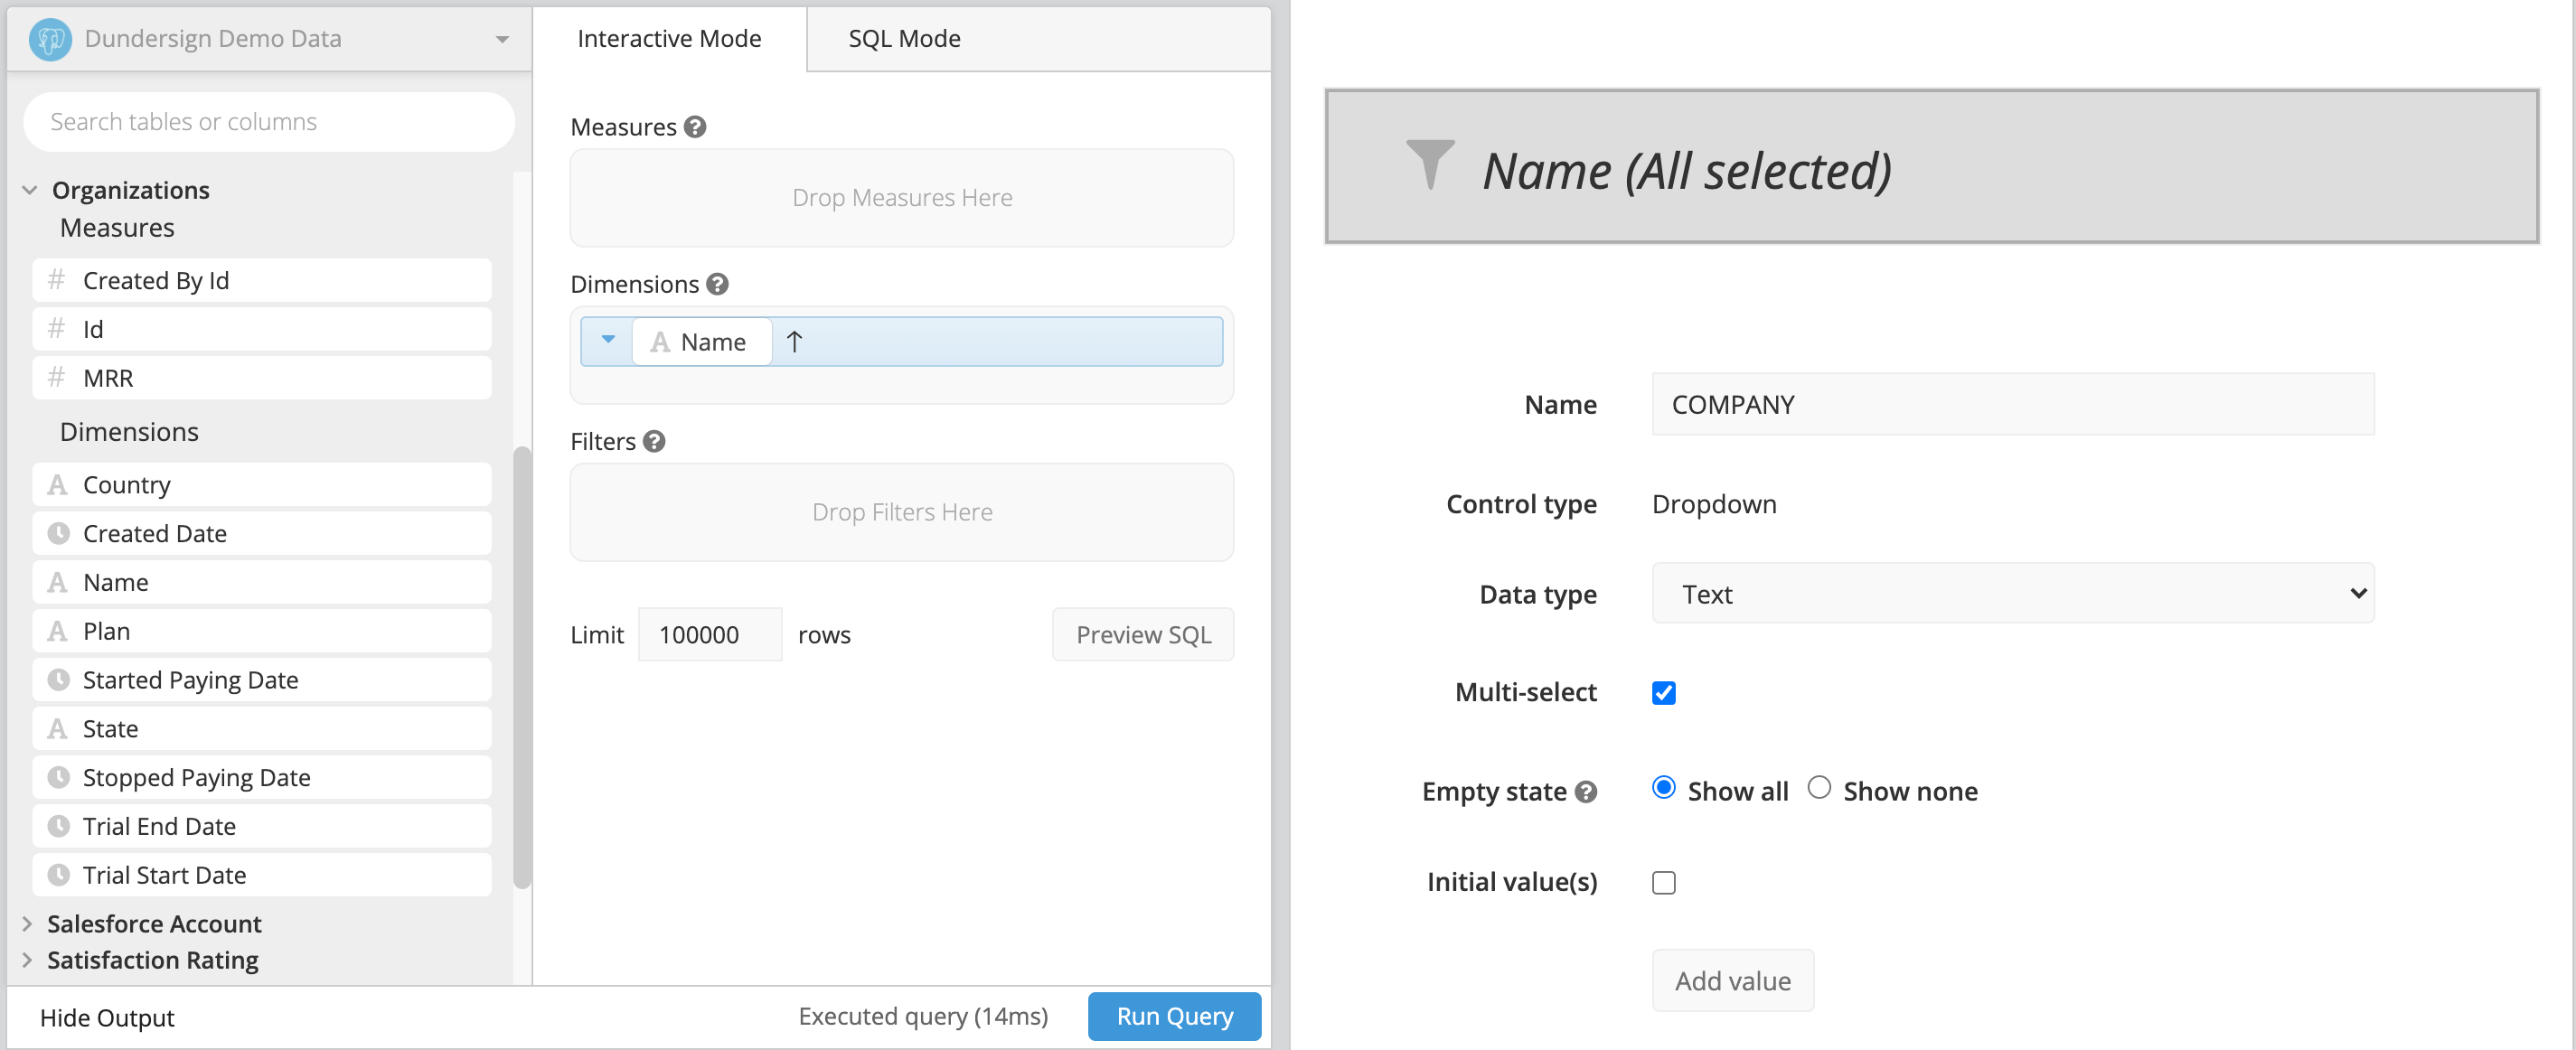
2. Connect your Dropdown to your chart
- Open your Data Explorer by clicking Edit Chart Data from the chart’s ellipsis menu.
-
Add the Name column to the filter box in the Data Explorer and select the options Is one of and
{COMPANY}.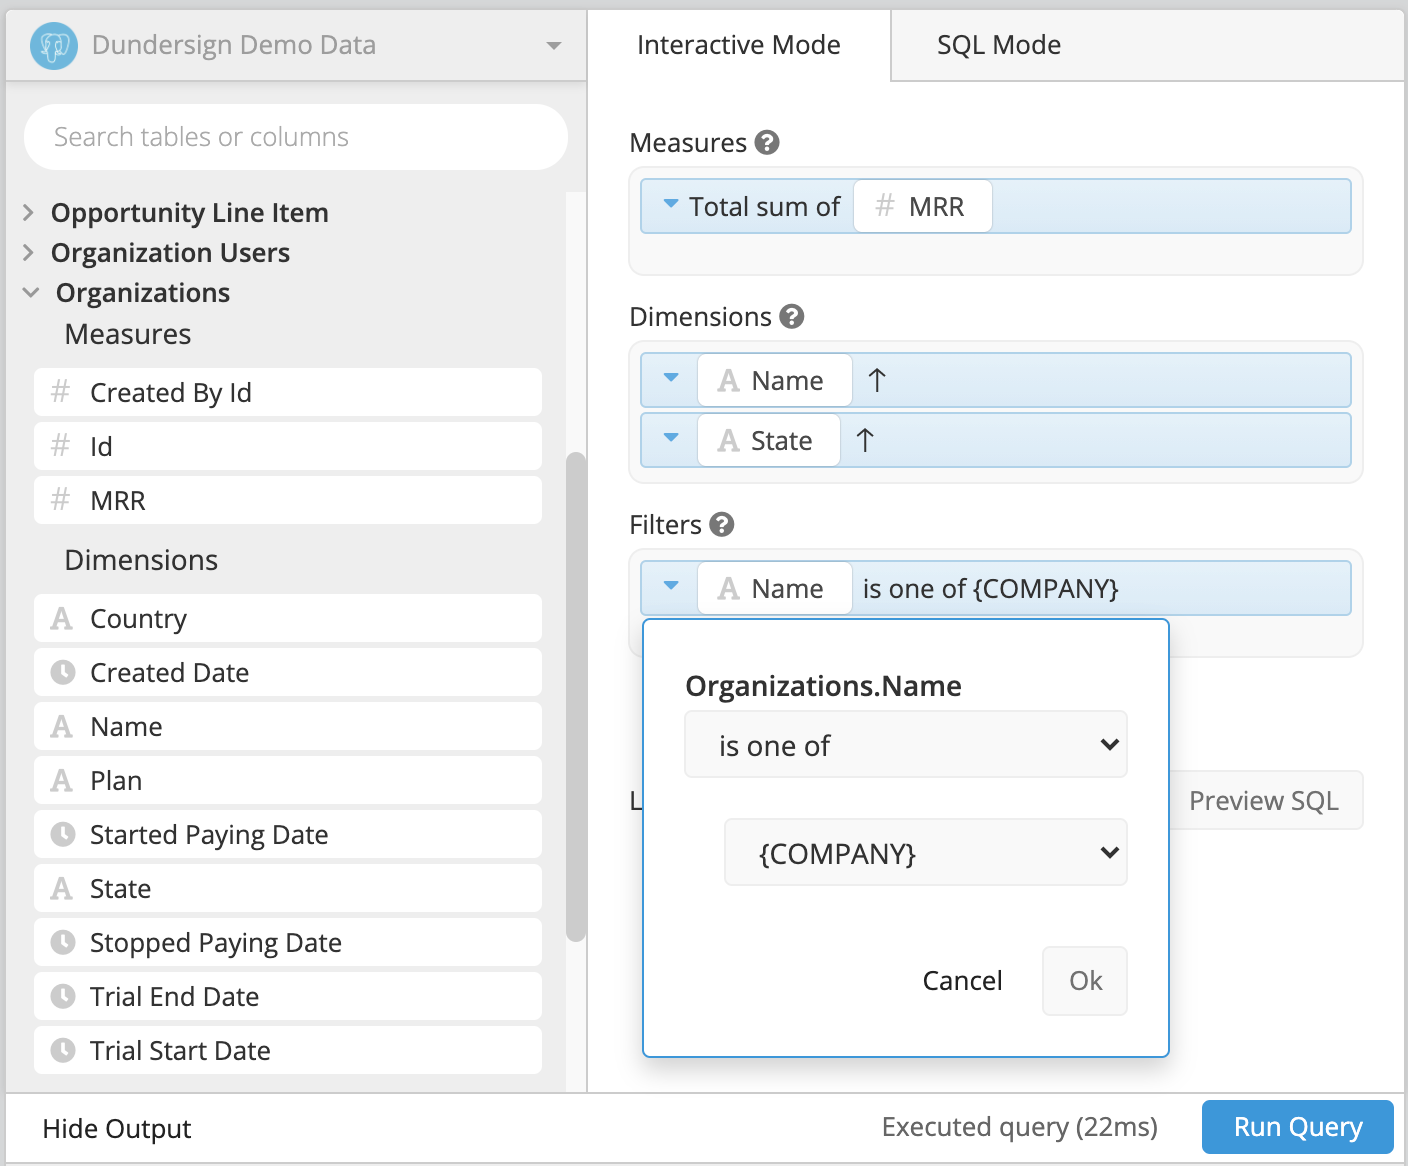
Your chart is now set up to filter using the Company Dropdown. To now get the company dropdown to be filtered itself, we’ll need to create another dropdown with the customers’ state.
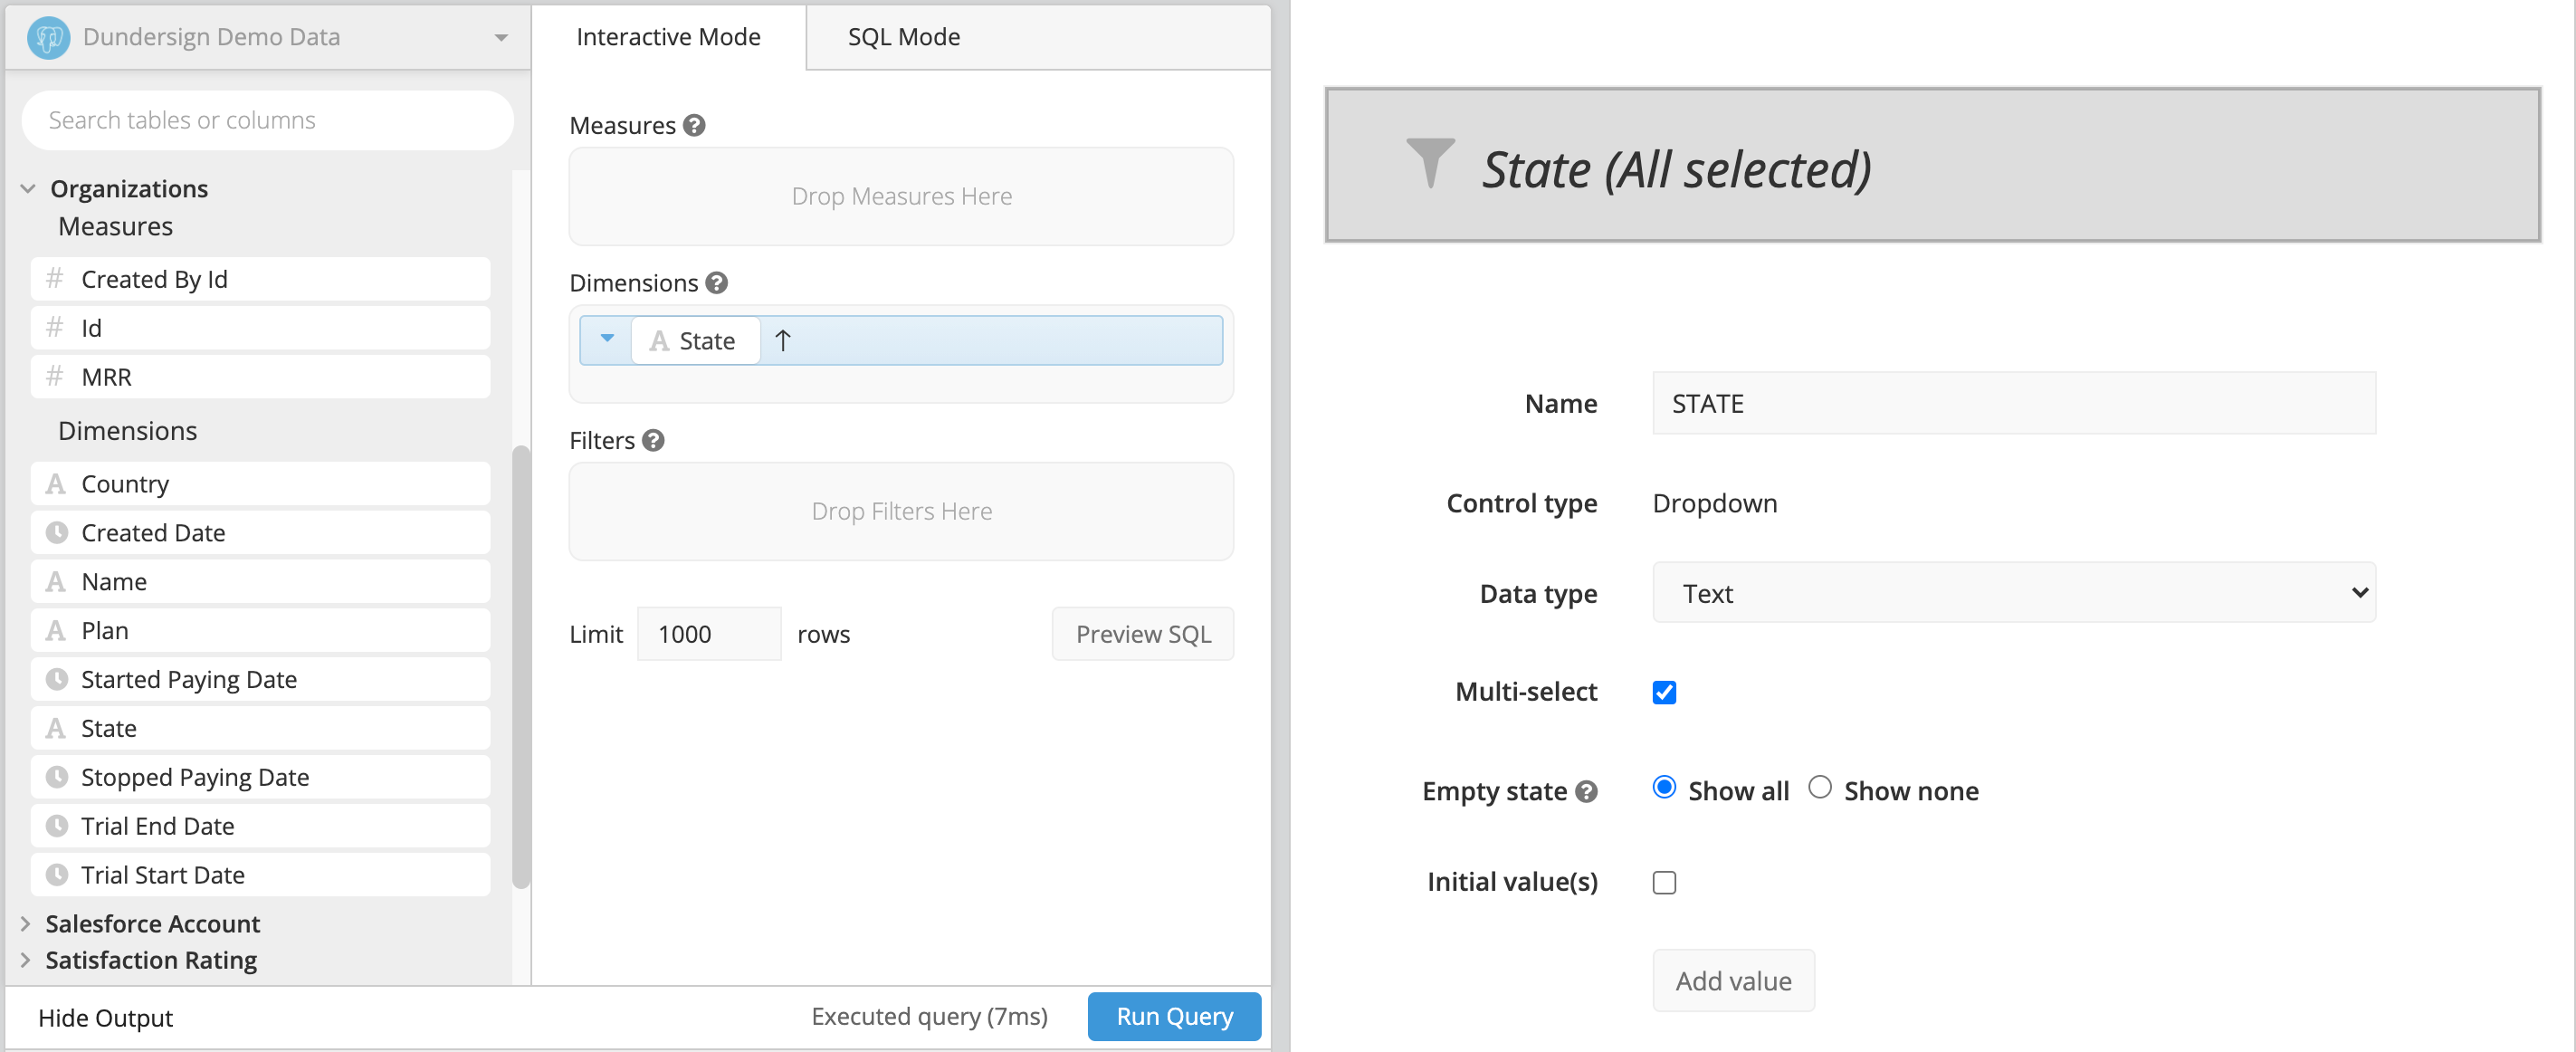
3. Create another Dropdown
The steps are basically the same as creating the Company Dropdown, but this time you’ll want to pull in the customers’ states by adding the State column from the Organizations table to the Dimensions field.
Name this Dropdown STATE, select Multi-select, choose Show All for the Empty state, and deselect Initial value(s). When you’re done changing the settings, click Save Chart to place your second Dropdown on your dashboard.
4. Use the new Dropdown to filter your initial Dropdown
To help narrow down the long list of companies in the Company Dropdown, add the State Dropdown to the Filters of the Company Dropdown.
- Edit the
COMPANYDropdown by opening its ellipsis menu and clicking Edit Filter. - Add the State column to the Filters field, select the is one of filter operator, and select
{STATE}for the filter value.
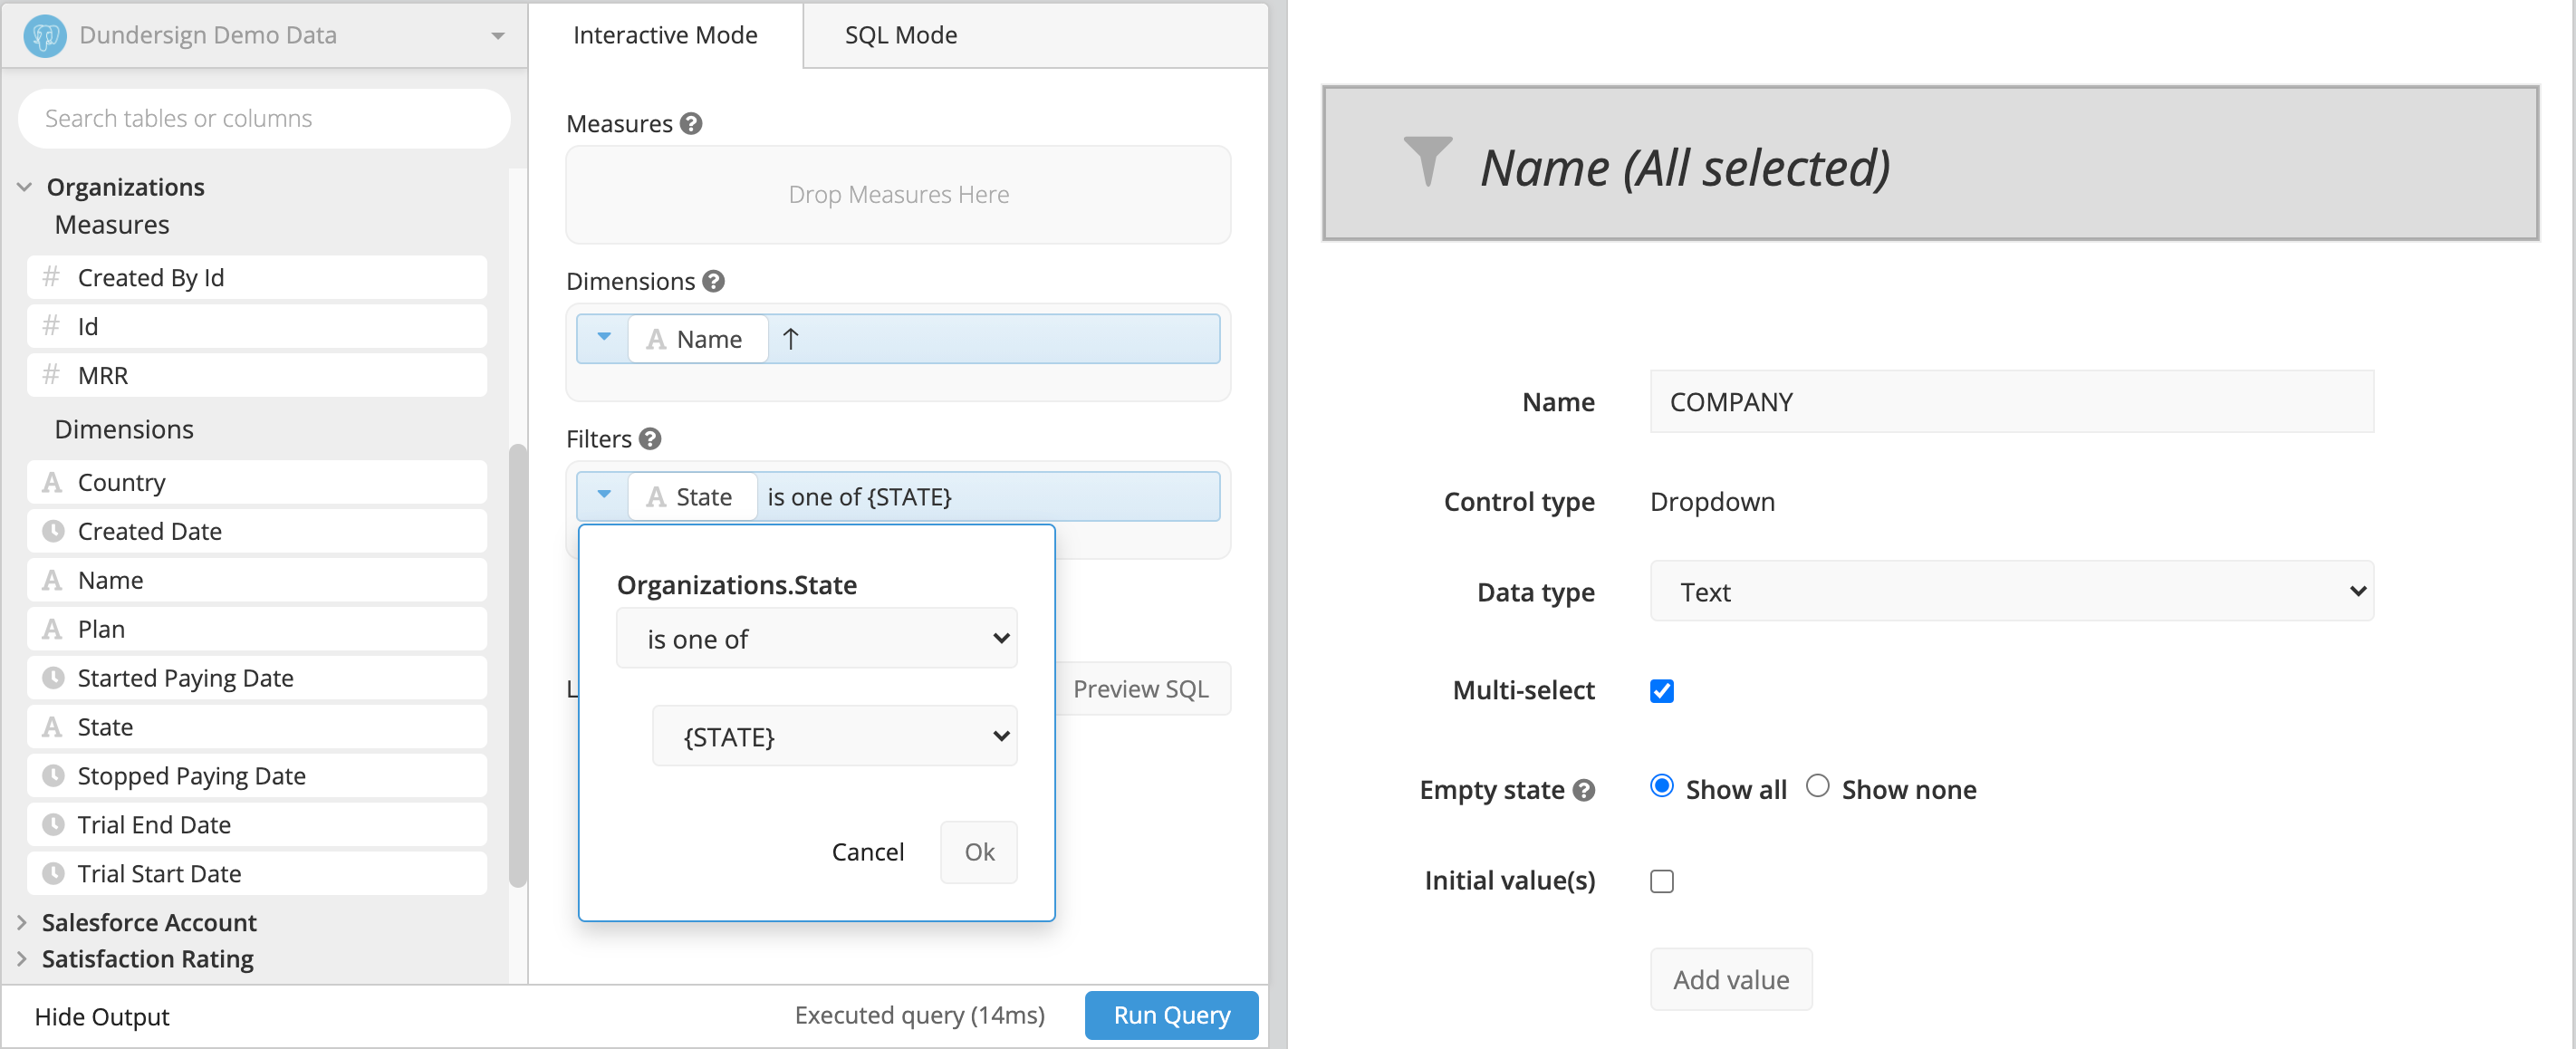
And there you have it. You can now make a selection for the State Dropdown to get a refined customer list in the Company Dropdown to better filter your Table.
This concept of dependency between Dashboard Controls can be applied in various ways, so don’t hesitate to play around with the different Dashboard Controls to customize your dashboard. For instance, try using a Text Input instead of the first Dropdown to manually enter filter options.