The Viewers guide for dashboards
Even if you’re not creating charts, you can still interact with your organization’s data in a limited capacity with Viewer level access to dashboards.
Need to know which dashboards you can access? You can go to your Dashboards landing page then click the All Items filter from the left sidebar. That’ll show you a list of all the dashboards in your org to which you currently have access.
Having Viewer access doesn’t take away the interactive features when viewing live dashboards. You can still…
- update Dashboard Controls to filter connected charts,
- hover over charts to view tooltips,
- use interactive legends to focus on specific series,
- and leave dashboard-level and chart-level comments for the dashboard admins if you have questions about the charts you’re seeing.
Dashboard sidebar actions
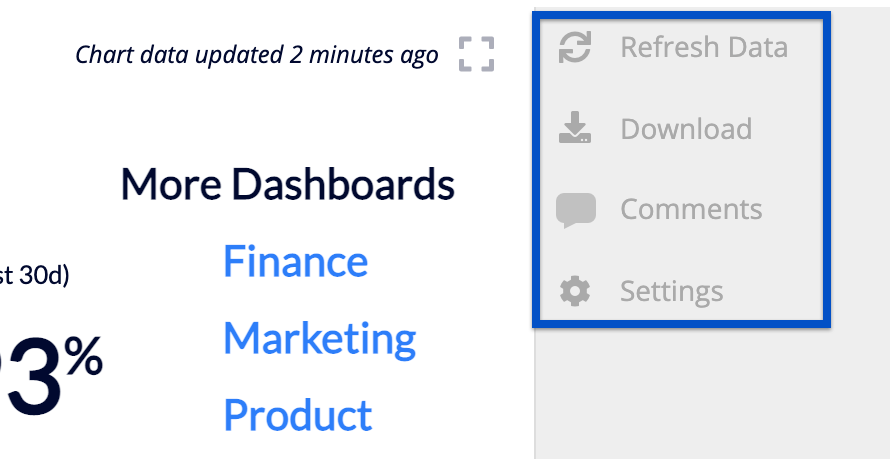
However, when you’re viewing a specific dashboard, you’ll notice there are limited actions available in the right sidebar.
-
Refresh Data
You’ll see this action if the Allow Viewers to Refresh Data setting is enabled for the dashboard. You can click this to manually refresh all the charts.
-
Download
Download the dashboard as a PDF or zip file of CSVs.
-
Comments
As mentioned above, you can leave dashboard-level comments, and the dashboard admins will receive an email notification to alert them of your post.
-
Settings
You’ll only see two tabs when you open the dashboard settings:
- Access: View a list of users with access to the dashboard and their access level. You can see your level of access and refer to this when you need to know who the Primary Admin is in case you need elevated permissions
- Activity: Keep track of changes made to the dashboard and optionally download the activity log as a CSV
You can also clone the dashboard, which creates a copy that you can edit without affecting the original version.
Tip! Clone dashboards that you’d like to use as a template for another chart you want to build.
Chart actions
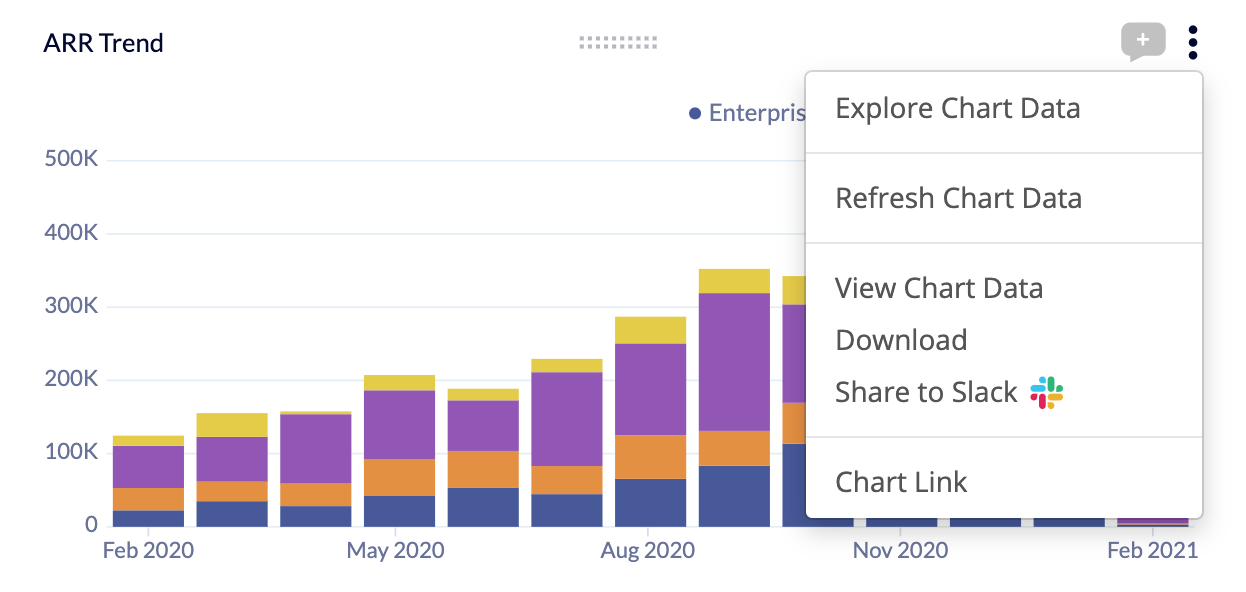
Similar to the limited dashboard actions, you’ll also have limited actions when opening the ellipsis menu of a chart.
-
If you have access to the data sources the chart uses, you can view all the logic used to create the chart. You can even edit the Queries and Actions in the chart’s Pipeline! However, if you want to save, you’ll only have the option to save a clone of the chart with your changes so you don’t affect the original chart.
-
If you’re able to refresh the data for the entire dashboard, you’d also be able to refresh the data for individual charts.
-
This opens a modal showing you a tabular view of the chart data. From here, you can sort columns, use the search bar to find specific rows of data, and optionally download this chart data as a CSV.
-
Download
You also have other file format options for downloading chart data: CSV, Google Sheets, PDF, PNG, or SVG.
-
Share to Slack
You’ll see this option if Slack integration is set up for your organization. This allows you to share the chart in your Slack workspace.
-
Chart Link
This is how you can copy the direct link to the chart if you ever need to share it with a colleague.