Add missing column after Pivot in Data Explorer
Let’s say you have five distinct values in a column, but your result set doesn’t have a row for one of those values. When you use a Pivot step on that column, the missing value won’t become a new column in your transformed result set. If you want this value to still be present, even though there are no rows for that value in your current result set, here’s how you can add that missing column.
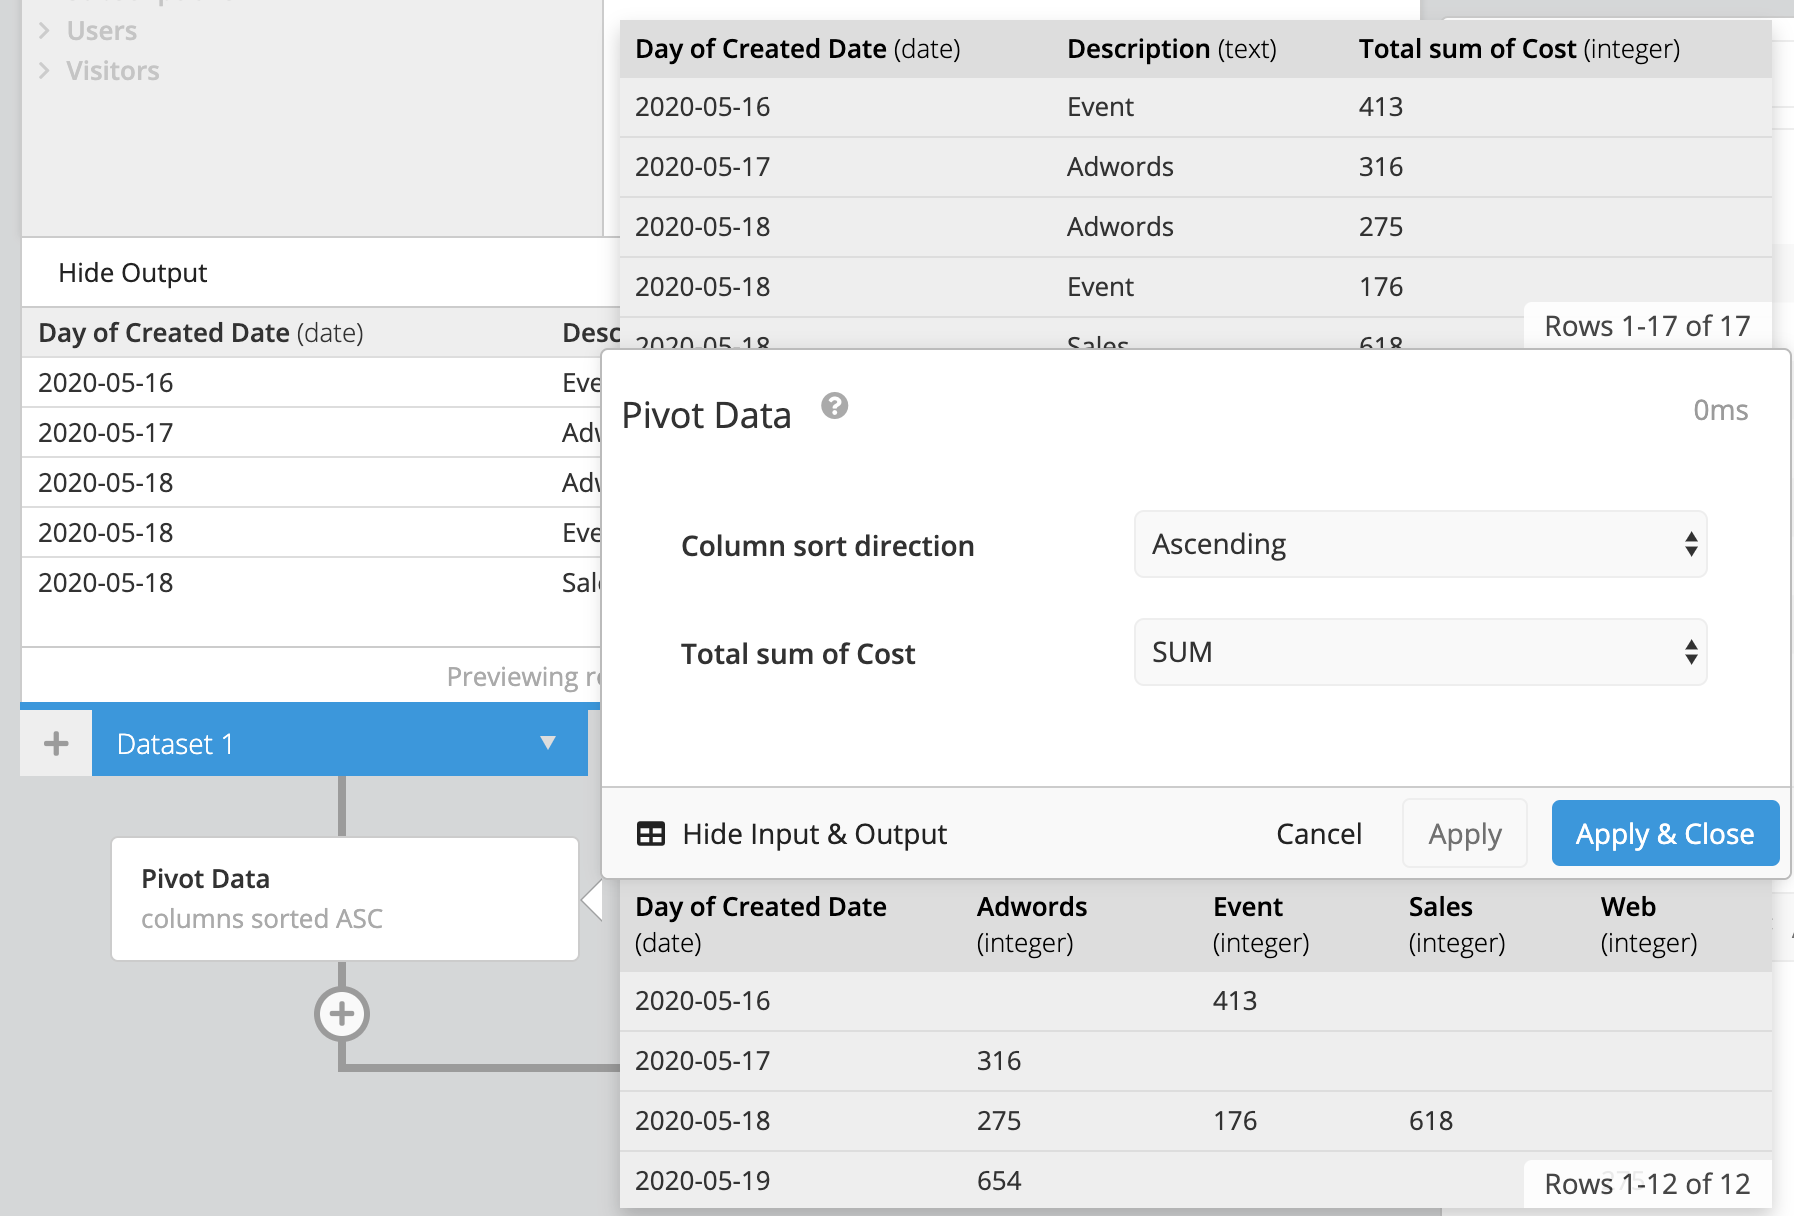
For our example, we want to get the total cost of each marketing campaign over a specified number of days; that number is pulled from a Text Input Control. We know there are five distinct values in our Description column: Adwords, Event, Print, Sales, and Web. However, depending on our filter, there may not be data for one or some of those campaigns for the given time period. As seen below, there are no rows related to the Print campaign when we query data over the past 12 days, so when we pivot that column in our Pipeline, no column for Print appears!

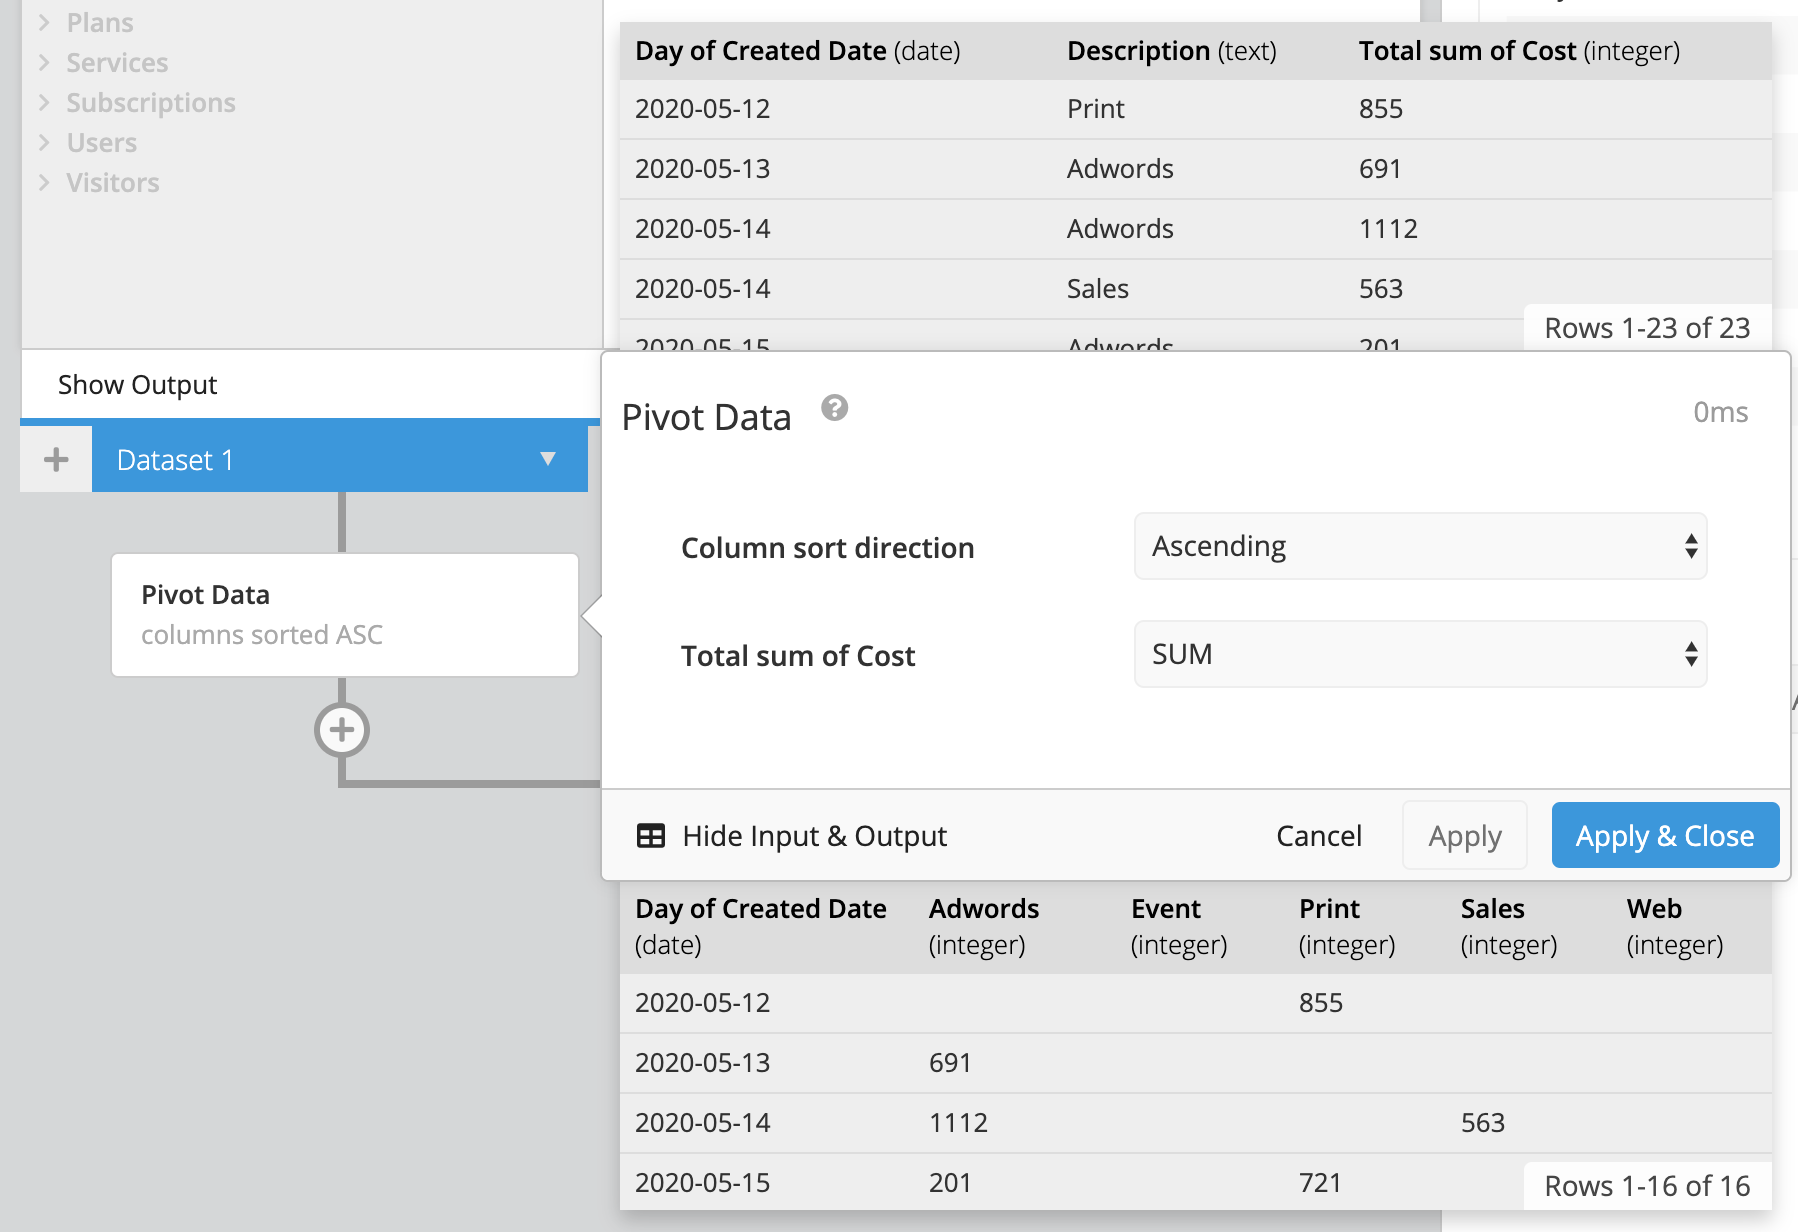
So what can we do? To make this work, we need to broaden our time range so all the distinct values are available in our initial query. For this example, we get at least one row for each campaign value when we look at the last 16 days rather than 12.

-
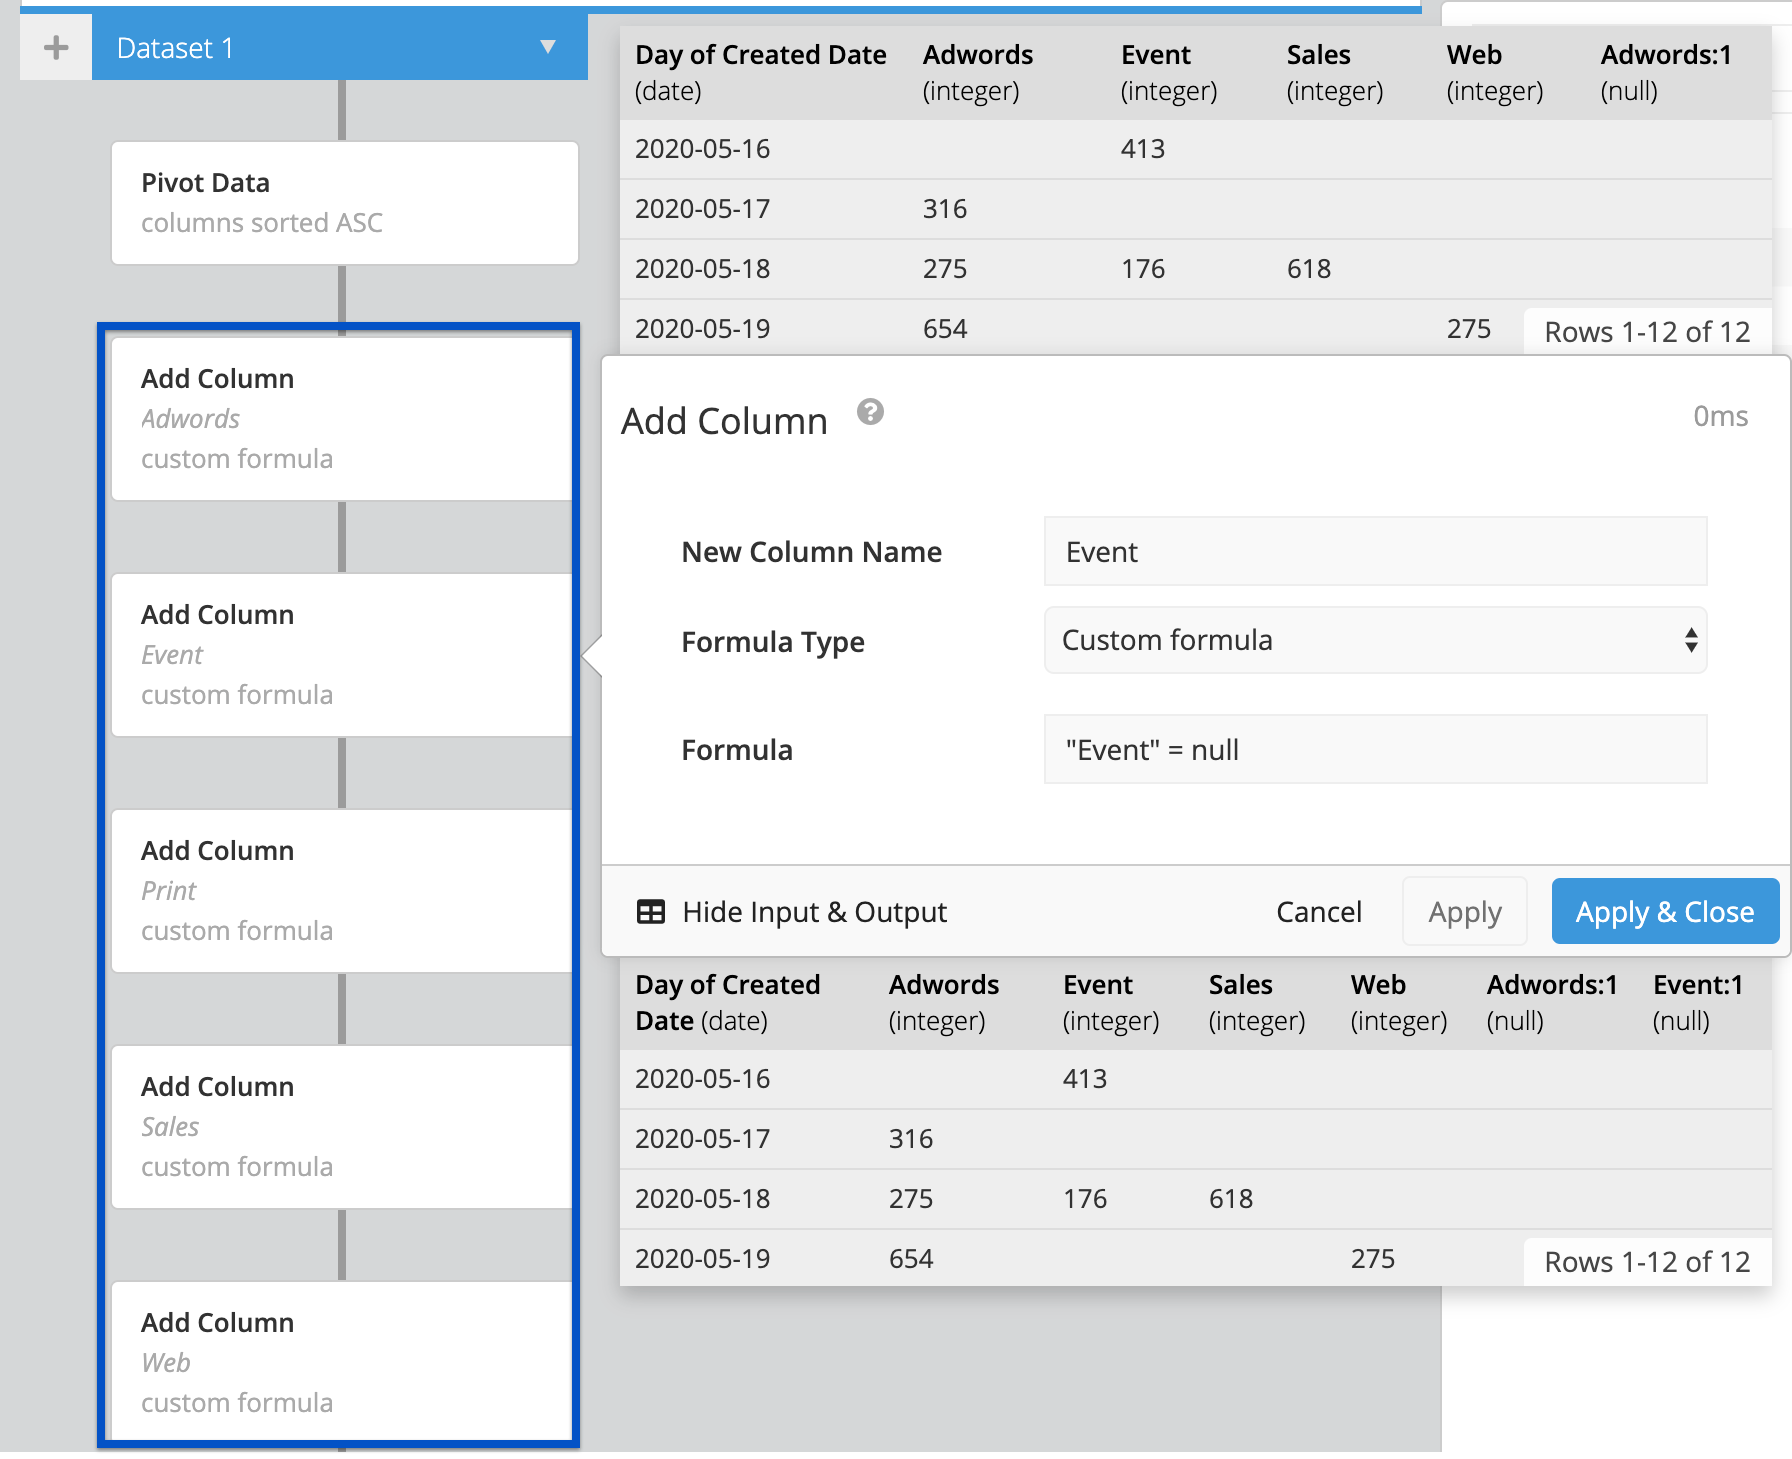
After the Pivot, we add a new column for each distinct value we know is in our column. Give the new columns the same names as the originals and use the following Custom formula:
"column_name" = nullreplacing
column_namewith the value.Here’s how it looks when we do this for our example:

-
If the column name already exists, Chartio appends
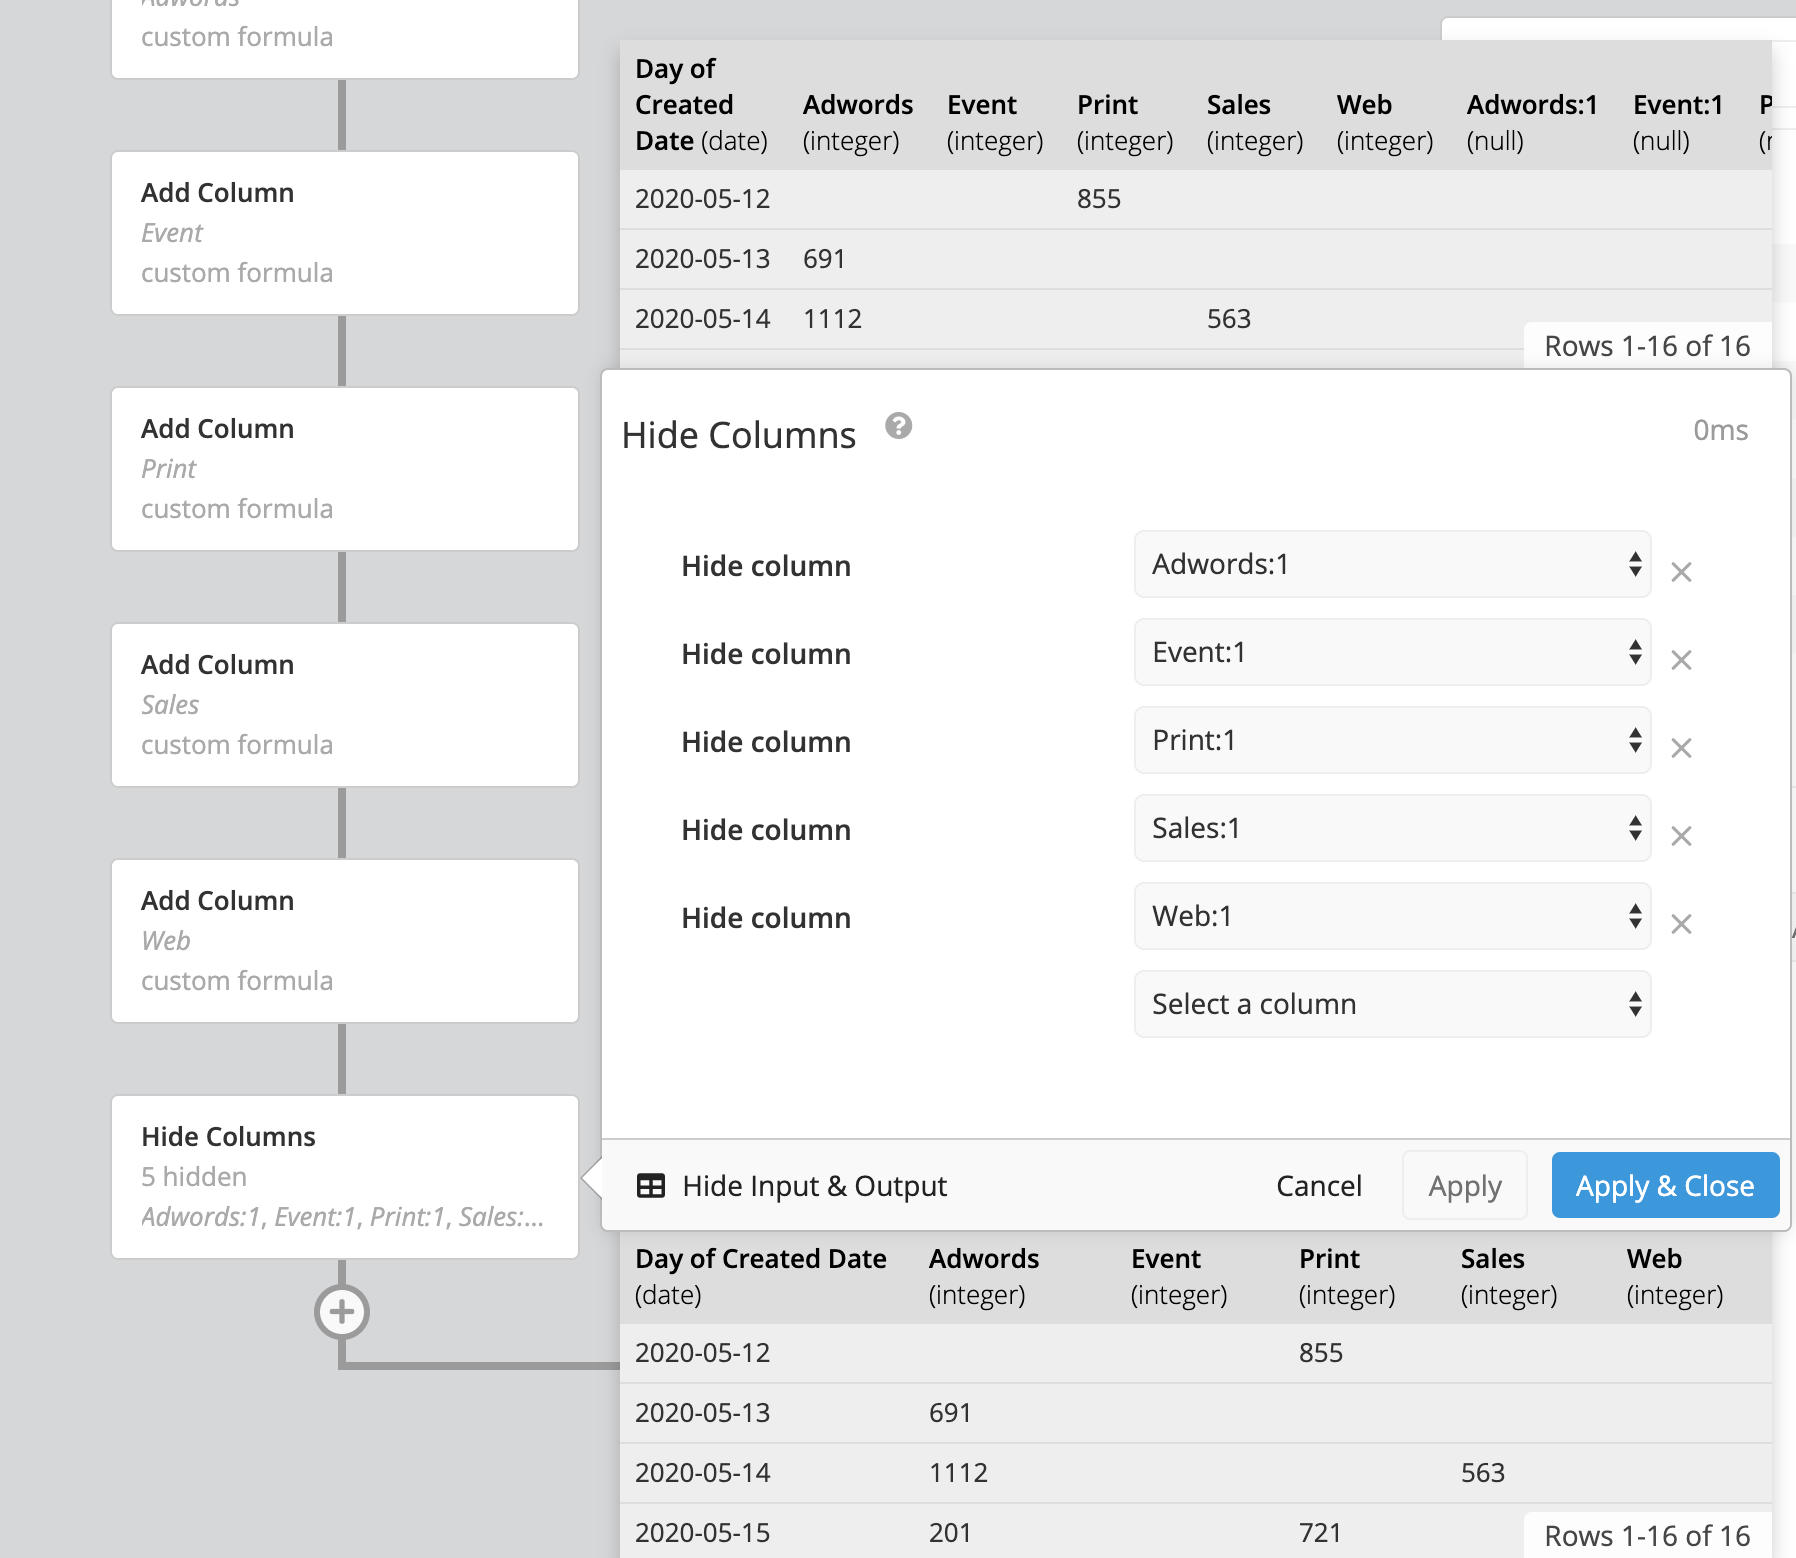
:1to the name of the new column with the same name to distinguish between the new and the original. This is why we use the same column names for our new columns—so we can identify if the column existed already or not. Now we can hide all columns with:1appended to it.
Now all our campaigns will be visible in the final Table chart!