Generate a time series in Data Explorer
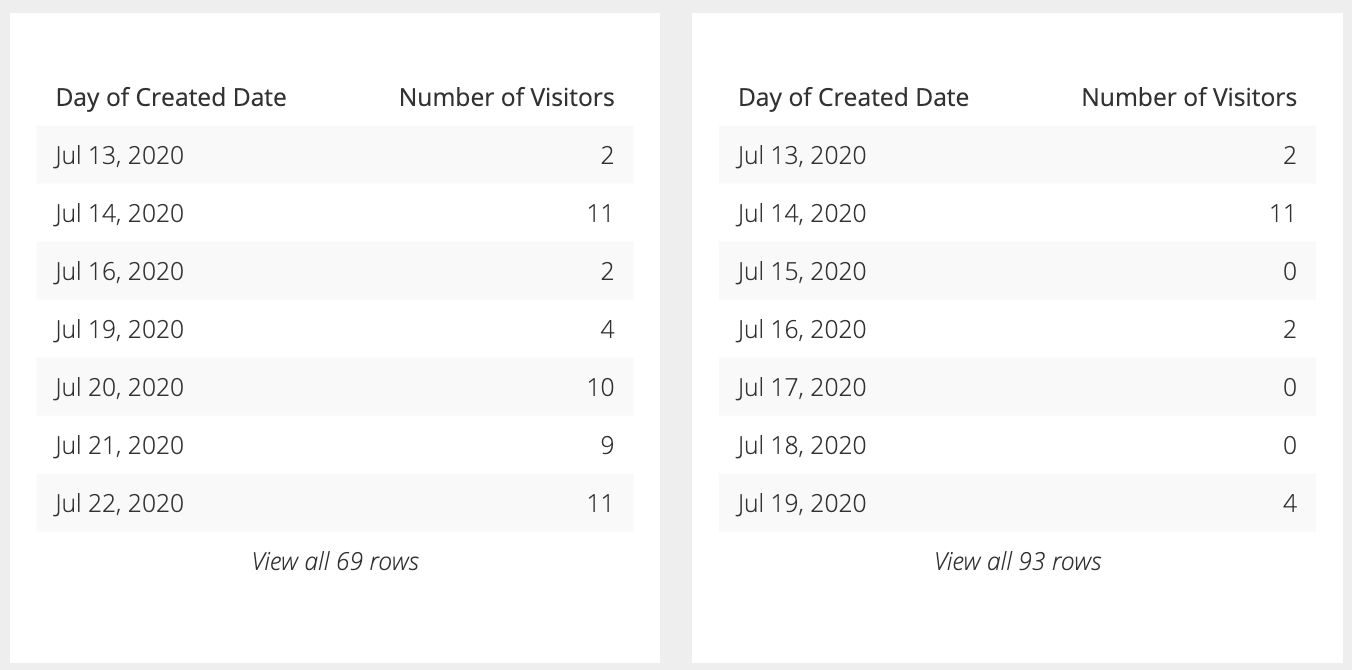
Charts that include time series are great for visualizing data over time and quickly recognizing trends. But an incomplete time series can result in a misleading representation of your data. For example, take a look at the time series below:

On the left, the series looks like it always has a consistent non-zero count. On the right, after adding in the missing dates, you can see the series does drop to zero on some dates, showing a more drastic variation between each day.

An easy way of fixing an incomplete time series is to join it with a complete list. So how do you do this? There are a few options:
Use generate_series()
PostgreSQL
PostgreSQL offers a convenient function to generate a continuous time series: generate_series(). This function takes in three arguments:
- Argument 1 is the starting timestamp
- Argument 2 is the ending timestamp
- Argument 3 is the step interval
Tip! Don’t have a PostgreSQL database? No problem! You can use our PostgreSQL demo data source to run any of the generate_series() examples below.
You can use generate_series() with any two timestamps including PostgreSQL’s built-in function that returns timestamps (e.g., CURRENT_TIMESTAMP) or Chartio’s built-in Relative Dates (e.g., {TODAY}::TIMESTAMP).
Here’s an example:
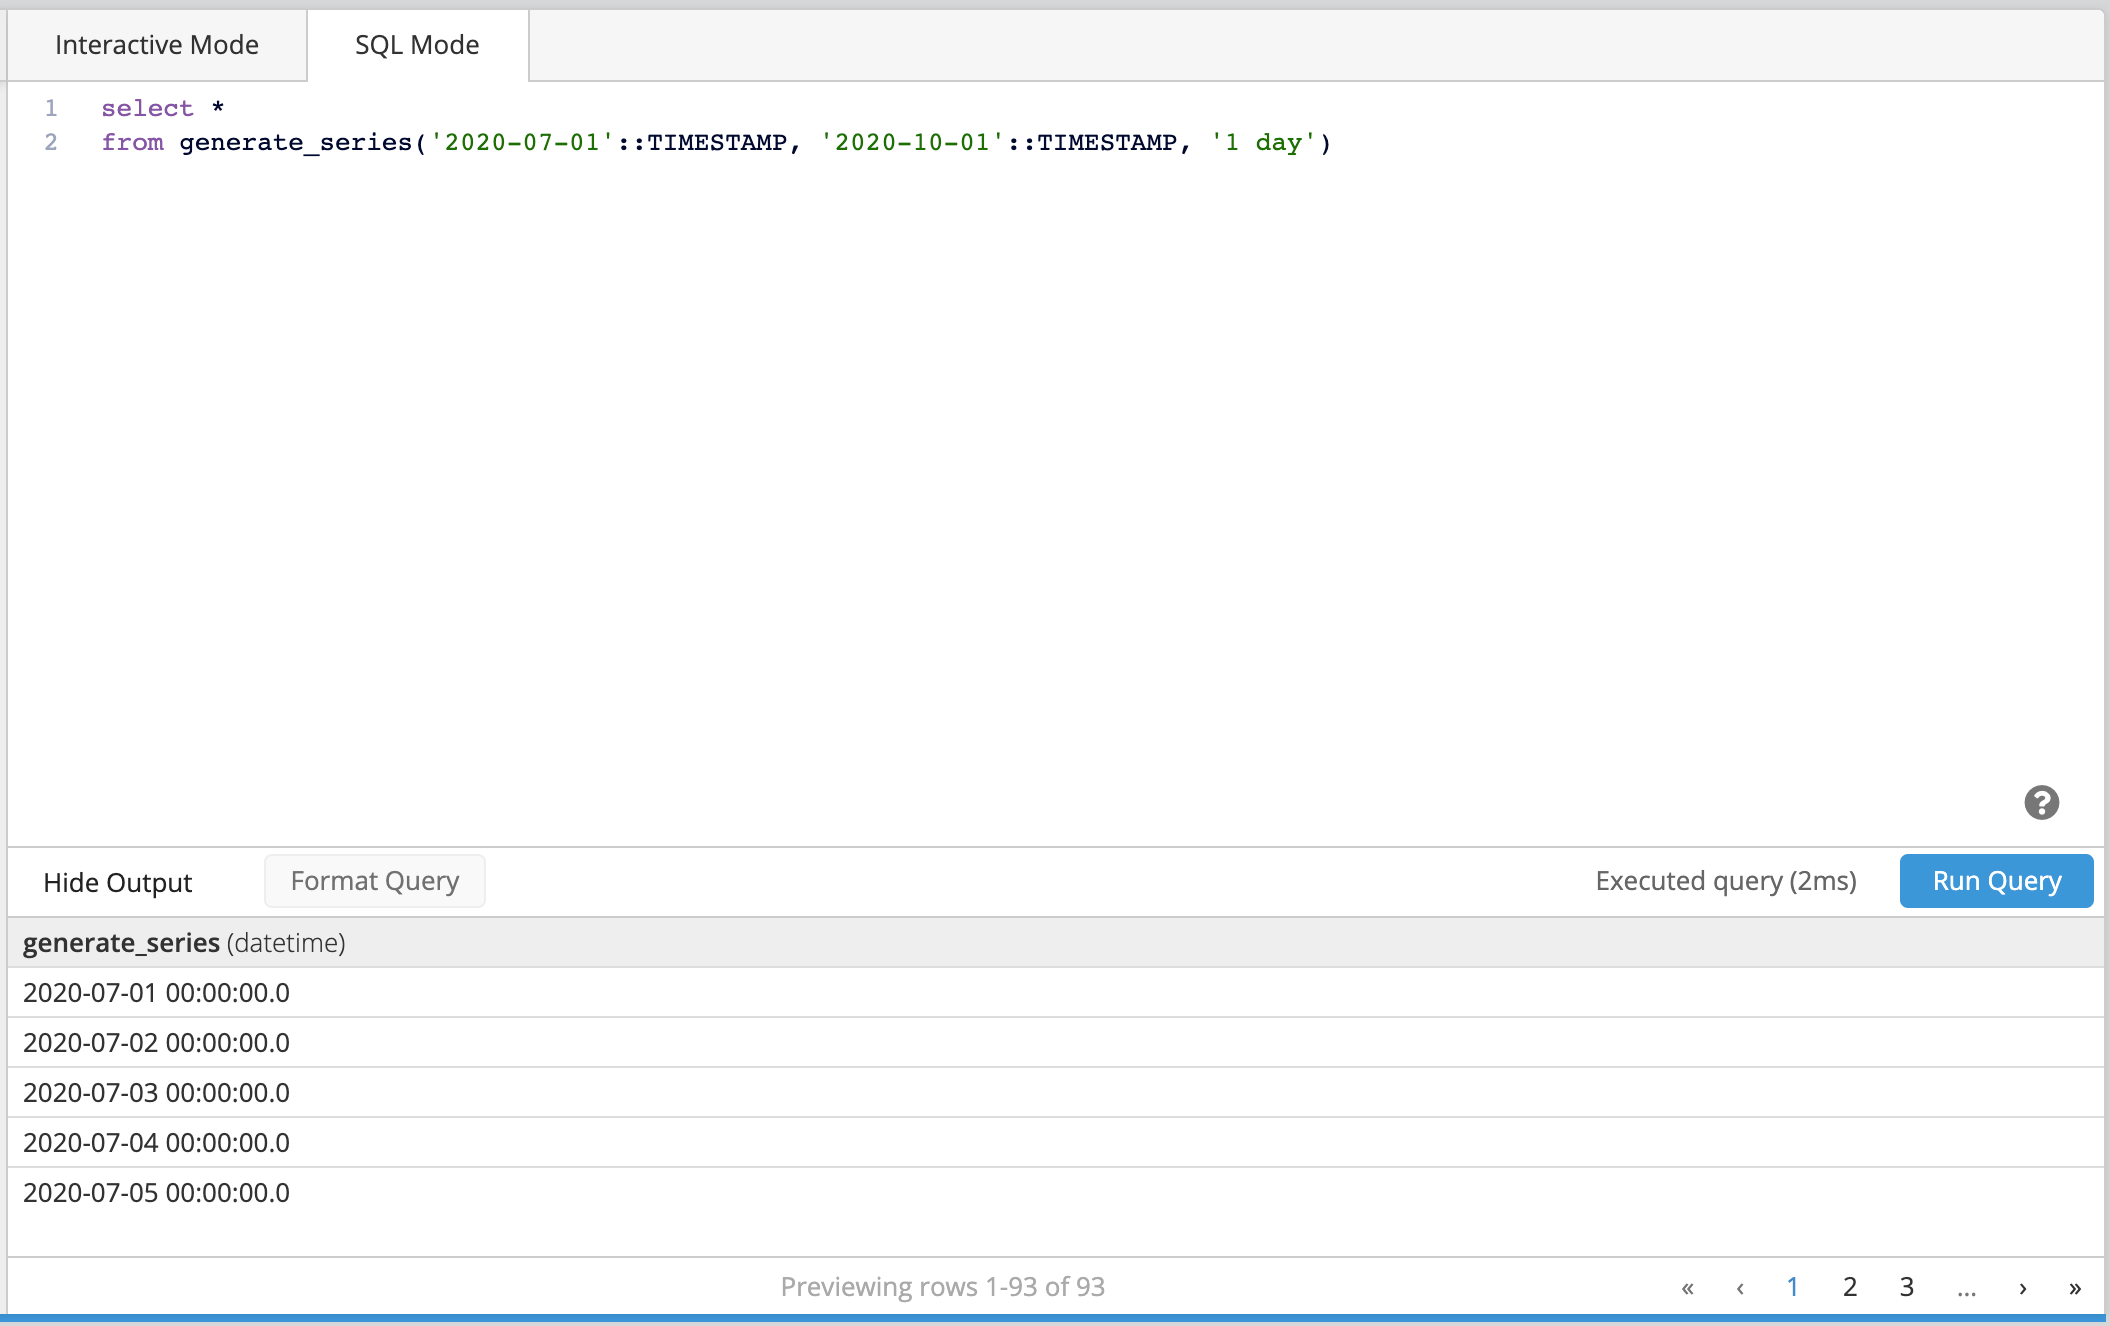
select *
from generate_series('2020-07-01'::TIMESTAMP, '2020-10-01'::TIMESTAMP, '1 day')
The above example outputs the following:

Here’s an example for how to generate a time series of dates, rather than datetimes:
select generate_series::date
from generate_series('2020-07-01'::TIMESTAMP, '2020-10-01'::TIMESTAMP, '1 day')
Here’s another example using Relative Date Variables and Datetime Functions as the start and end timestamp:
select *
from generate_series({TODAY.SUB(3, 'months')}::TIMESTAMP, {TODAY}::TIMESTAMP, '1 day')
Amazon Redshift
Some Postgres functions are available in Redshift and generate_series() happens to be one of them, but the arguments it takes are slightly different:
- Argument 1 is the starting number; use 0 if you want to include the starting date
- Argument 2 is the number of dates you want to return
- Argument 3 is the step interval; optional
Here’s an example:
select (getdate()::date - generate_series)::date as series
from generate_series(0,30,1)
order by series asc
getdate() returns the current date, but you can always replace it with a specific date to better fit your use case (e.g., '2020-10-01'::date).
Generate a series without generate_series()
If you’re not using PostgreSQL or Amazon Redshift, there are other options for databases that don’t natively support generate_series().
An easy alternative that can work with any database is using a continuous list of numbers starting at zero that can be converted into a sequence of dates. You can either create this table or use an existing column in a table if that table contains a sequential row ID column with no deleted rows. You can then convert each number into a date by subtracting the current date with the numbers column to build a continuous list of dates.
For these examples, numbers_column is the column that contains a continuous list of numbers starting at zero and numbers_table is the table that contains the numbers_column column.
Note: You can replace CURRENT_DATE in any of the following examples with any date value you want your time series to start from using the following format: ‘YYYY-MM-DD'::date or 'YYYY-MM-DD HH:mm:ss.S'::timestamp. You can also apply a LIMIT clause to specify how many dates you want to generate.
Amazon Redshift
select (getdate()::date - numbers_column)::date from numbers_table
If you don’t have an existing column with the necessary values, you can instead use a Common Table Expression (CTE) to create it.
-- Use a CTE to create the numbers column and numbers table
with numbers_table as (select row_number() over () as numbers_column
from table_name
limit 100)
-- Generate your series of dates
select (getdate()::date - numbers_column)::date from numbers_table
MySQL
select date_sub(CURDATE()), interval 1 day) from numbers_table
If you don’t have an existing numbers column or table in your MySQL database, you can create one using variables to generate a numbers column. Ensure the table you replace any_table with has at least as many rows as the number of dates you want to generate. For example, if you want a series of 10 dates, the table you use for the following query needs to have at least 10 rows. Apply a LIMIT clause to specify how many dates you want to generate.
set @n:=CURDATE() + interval 1 day;
select (select @n:= @n - interval 1 day) number_column
from any_table
limit 100
Google BigQuery (STANDARD SQL)
select date_sub(CURRENT_DATE, interval 1 day) from numbers_table
Generate a series with window functions
Another option for generating a continuous series is to use a window function to create one. Ensure the table you replace any_table with has at least as many rows as the number of dates you want to generate. For example, if you want a series of 10 dates, the table you use for the following query needs to have at least 10 rows. Apply a LIMIT clause to specify how many dates you want to generate.
Amazon Redshift
select (getdate()::date - row_number() over (order by true))::date as series
from any_table
limit 100
Google BigQuery
select date_sub(CURRENT_DATE, interval row_number() over () day)
from any_table
limit 100
Now that you’ve generated a complete list of dates, you can use an Outer Join to merge this with your original dataset to create a complete time series. If you’re experiencing weird date labels for your charts, you can also use this method to fix your x-axis date labels.