Round numbers in Data Explorer
The Add Column and Edit Column steps in Chartio’s Data Pipeline allow you to perform functions on your data, including our custom functions, standard SQLite functions, and the following math functions: degrees(), radians(), cos(), sin(), tan(), cosh(), sinh(), tanh(), exp(), log(), log10(), sqrt(), ceil(), floor()
Check out the full list of SQLite functions to see what other transformations are possible.
If you’re performing a calculation on your data, you’ll often need to round the resulting numbers.
Round function
If you’re performing a calculation on your data, you’ll often need to round the resulting numbers.
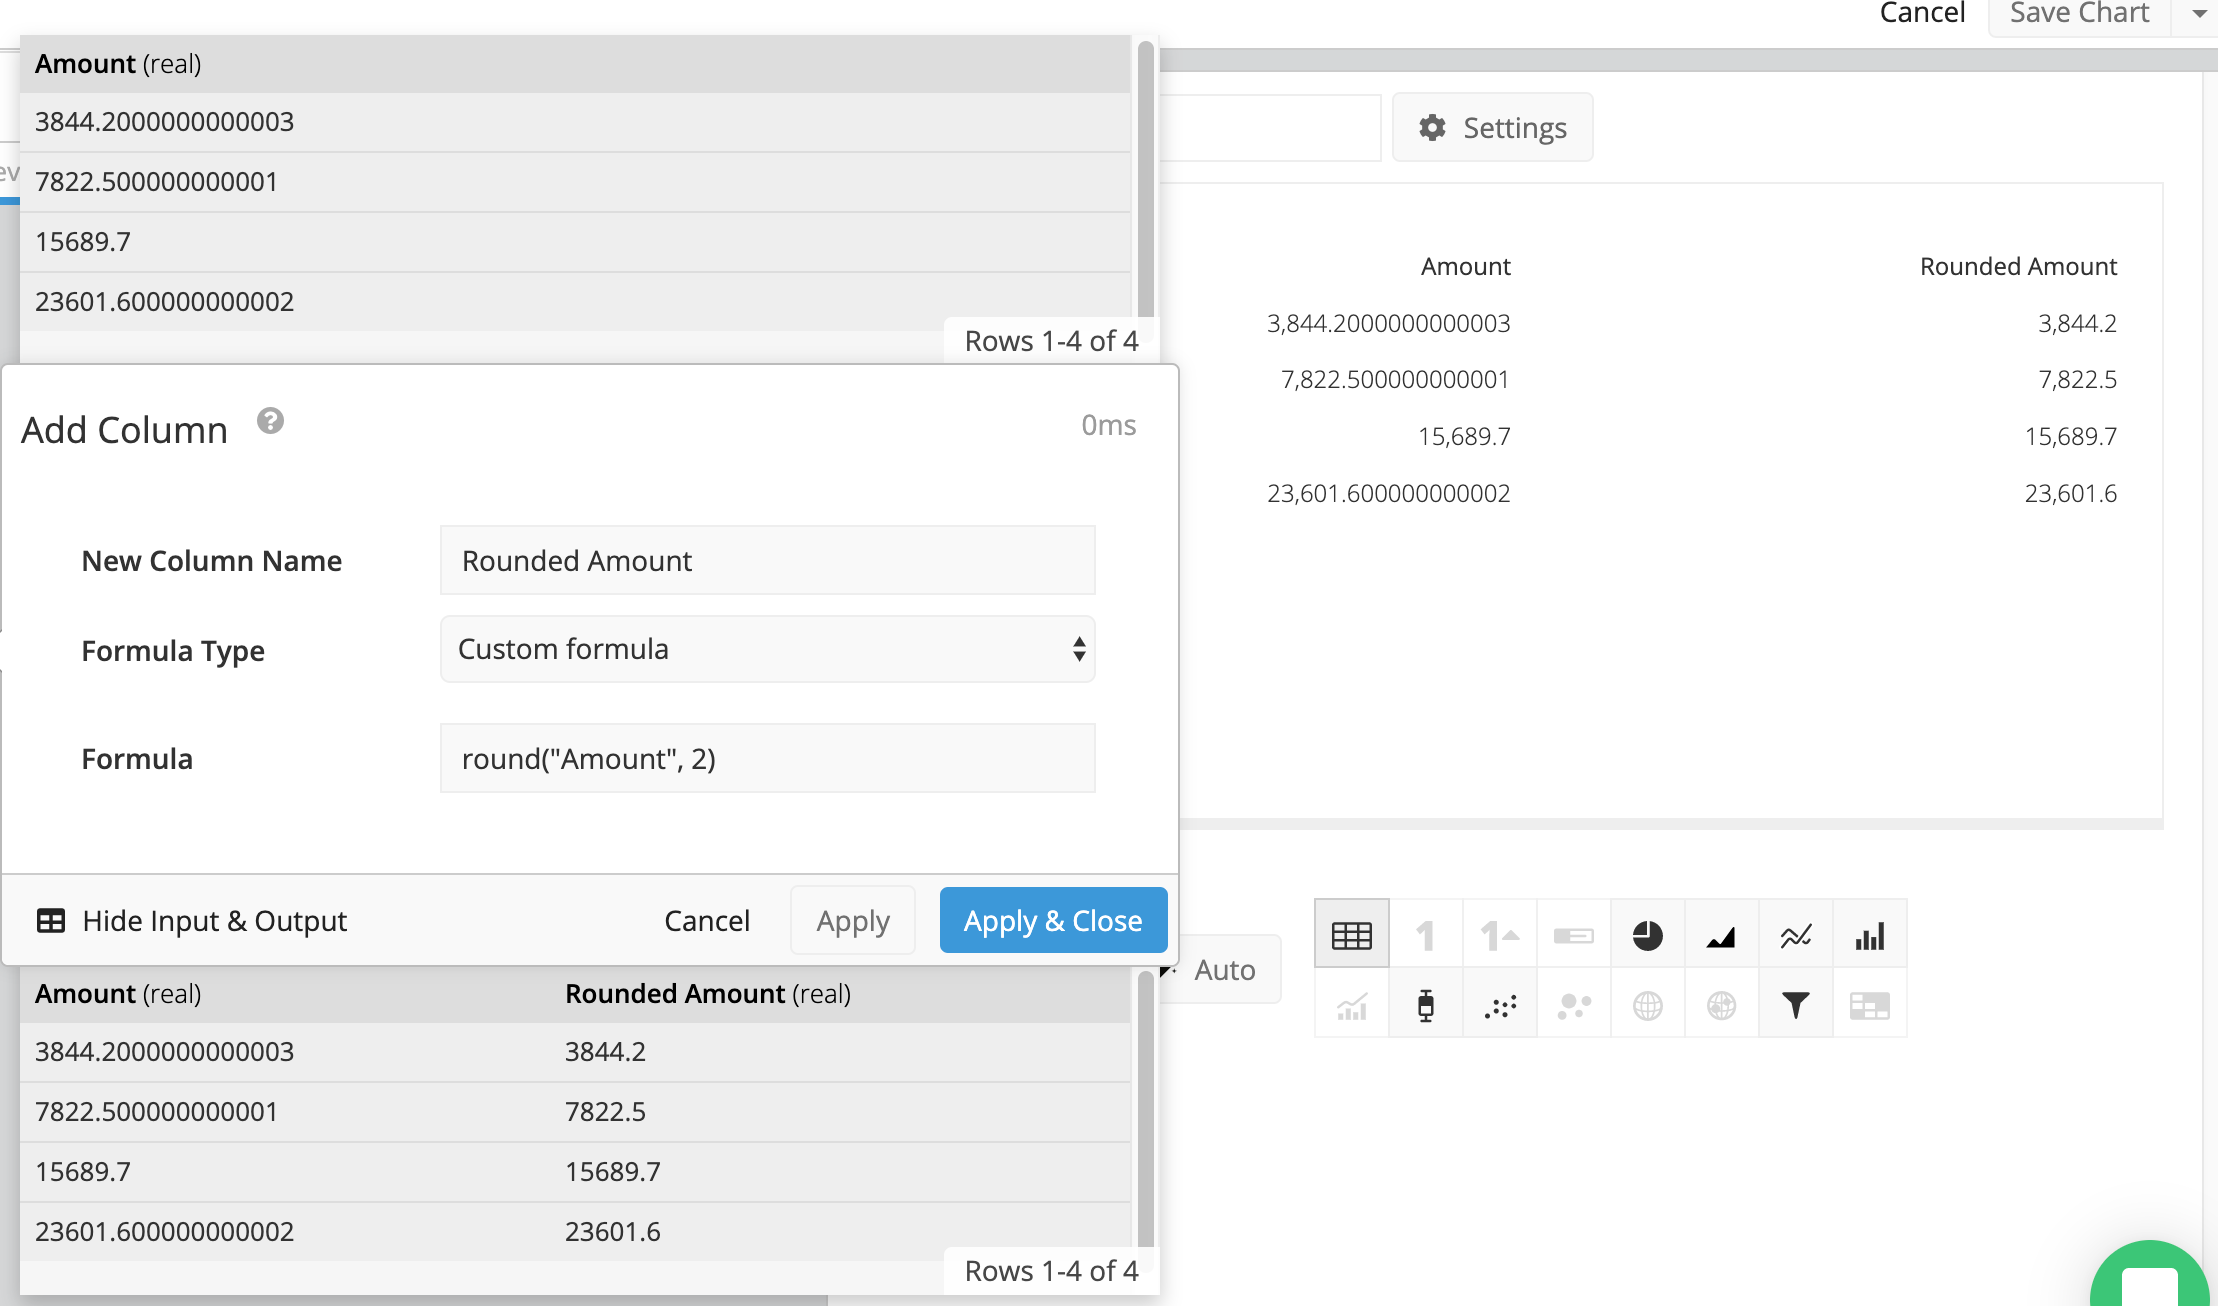
With your chart open in the Data Explorer, click the +Add Transformation button in the Data Pipeline, and choose Add Column from the menu options. Label your column, and in the Custom formula section add the following formula:
round("Column Name", 2)
Where Column Name is the name of the column you’d like to round, and 2 is the number of decimal points you’d like to round up to in your column.
Click Apply to apply the changes and keep the pipeline step open to preview your data and see the transformation. Click Apply & Close to apply the changes and close the Pipeline step.

If you’re performing a calculation on integers, then only integers will be returned. If you want your results to have decimal precision, you’ll need to convert your values to decimals before performing any calculations.
You can do this by adding an Edit Column step in the Data Pipeline. Use a Custom Formula and multiply your formula numerator by 1.0. For example:
(1.0 * "Column 1")/"Column 2"
Multiplying “Column 1” by 1.0 will force the value to be converted to the data type “real” and show decimal precision.
You can also do this directly within the round() function as done in the example below:
round(1.0 * "Column1" / "Column2", 2)
Casting the column as an integer
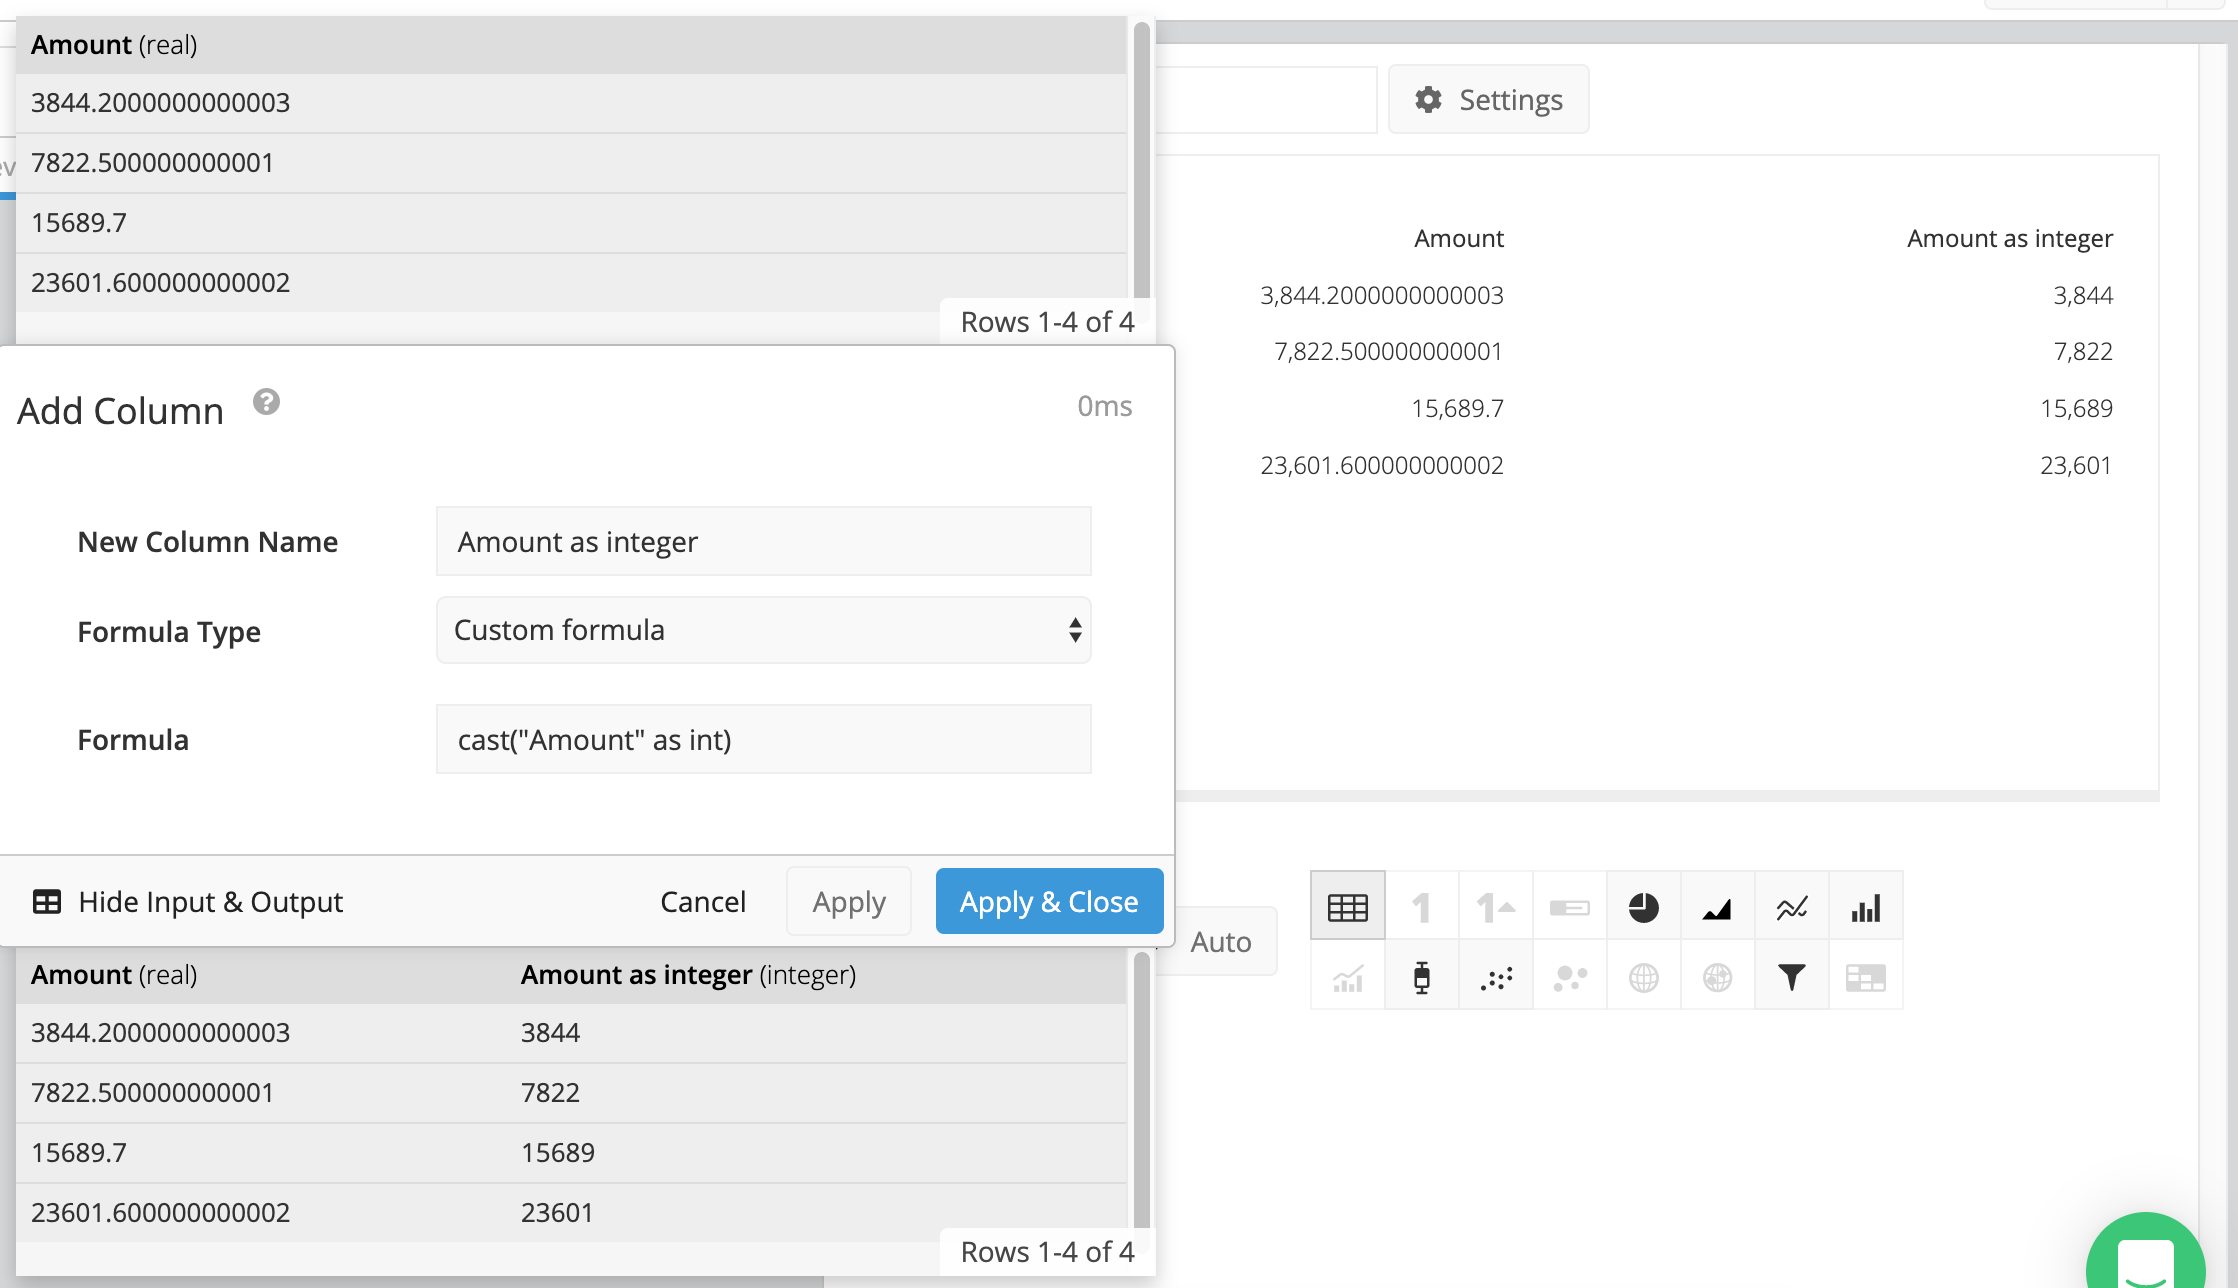
If you want to remove all decimals from your values, you can also cast your column as an integer. This will convert all of the values into whole numbers.
In the Data Pipeline of your chart, click +Add Transformation and choose Add Column from the menu options. Name your column, and enter the following into the formula field:
cast("Column Name" as int)
Where Column Name is the name of your original column.

Note: You can also apply these changes to existing columns by using the Edit Column pipeline step instead of Add Column.