Filter by complete days in Data Explorer
Let’s say you want your chart to look at a time range relative to the current date. There are various date filter operators, but which one should you use? It depends! If you want your dates to be dependent on timestamps, you’d use a relative date filter operator. If you want to use full dates, you’d use an absolute date filter operator.
Consider this scenario: You refresh your chart on August 18th at 9 AM. What’s the time range your chart would look at if you were to use a relative date filter operator or an absolute date filter operator?
Relative date filter operators
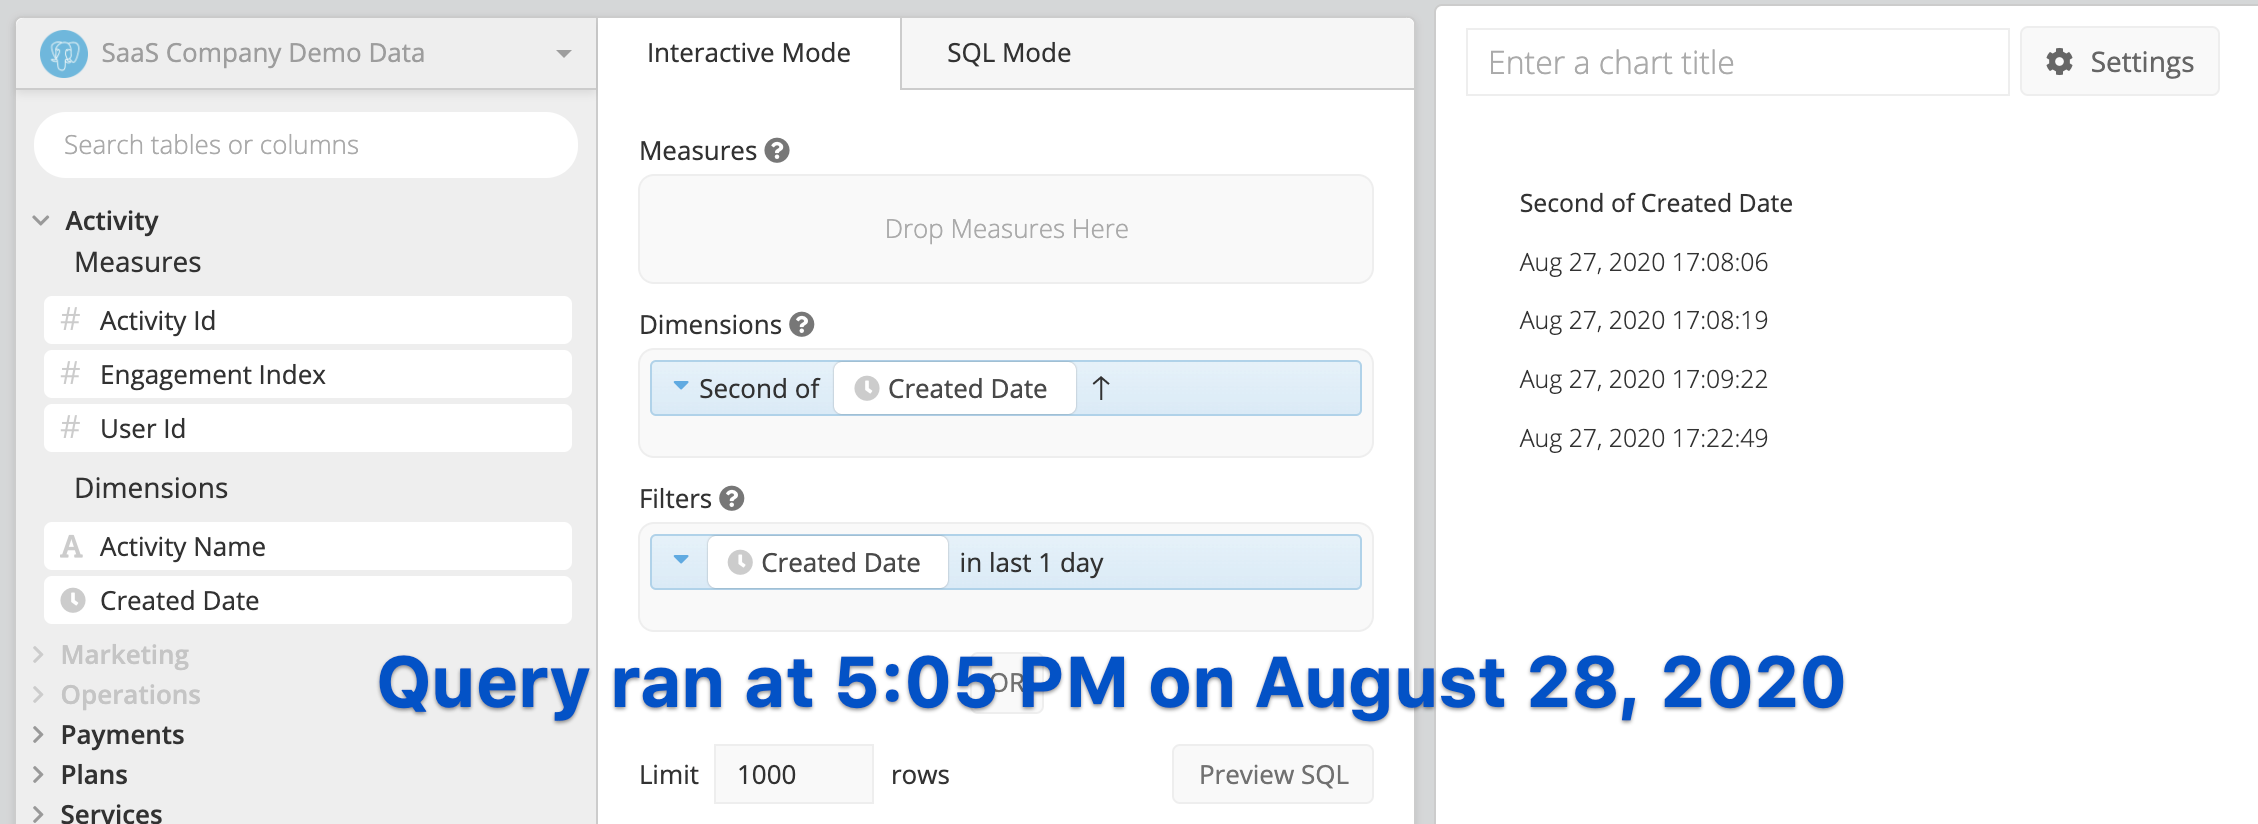
Our relative date filter operators are the “last N…” or “between N and M…” operators.
Let’s continue with the scenario we mentioned above. What if our chart filters the data on the “last N days”? This subtracts N * 24 hours from the current timestamp. So if N is 1, the data we’d get back would be from the last 24 hours starting at 9 AM on August 18th; in other words, the time range of our chart would be from 9 AM August 17th to 9 AM August 18th. If we had any data before 9 AM on August 17th or after 9 AM on August 18th, it wouldn’t be included in our chart.
If you want to include the full day and disregard timestamps, you can use Relative Date Variables with our absolute date filter operators.
SQL Mode
Note: The syntax used for our examples is PostgreSQL syntax. The syntax and functions may vary depending on your data source type.
If you prefer to use SQL Mode, you can use the following condition, which uses the NOW() function, in your WHERE clause, replacing date_column with your date/datetime column’s name:
WHERE ("date_column" BETWEEN NOW() - INTERVAL '1 DAY' AND NOW())
Absolute date filter operators
Our absolute date filter operators are the “earlier than”, “later than”, “between”, and “between and including” operators.
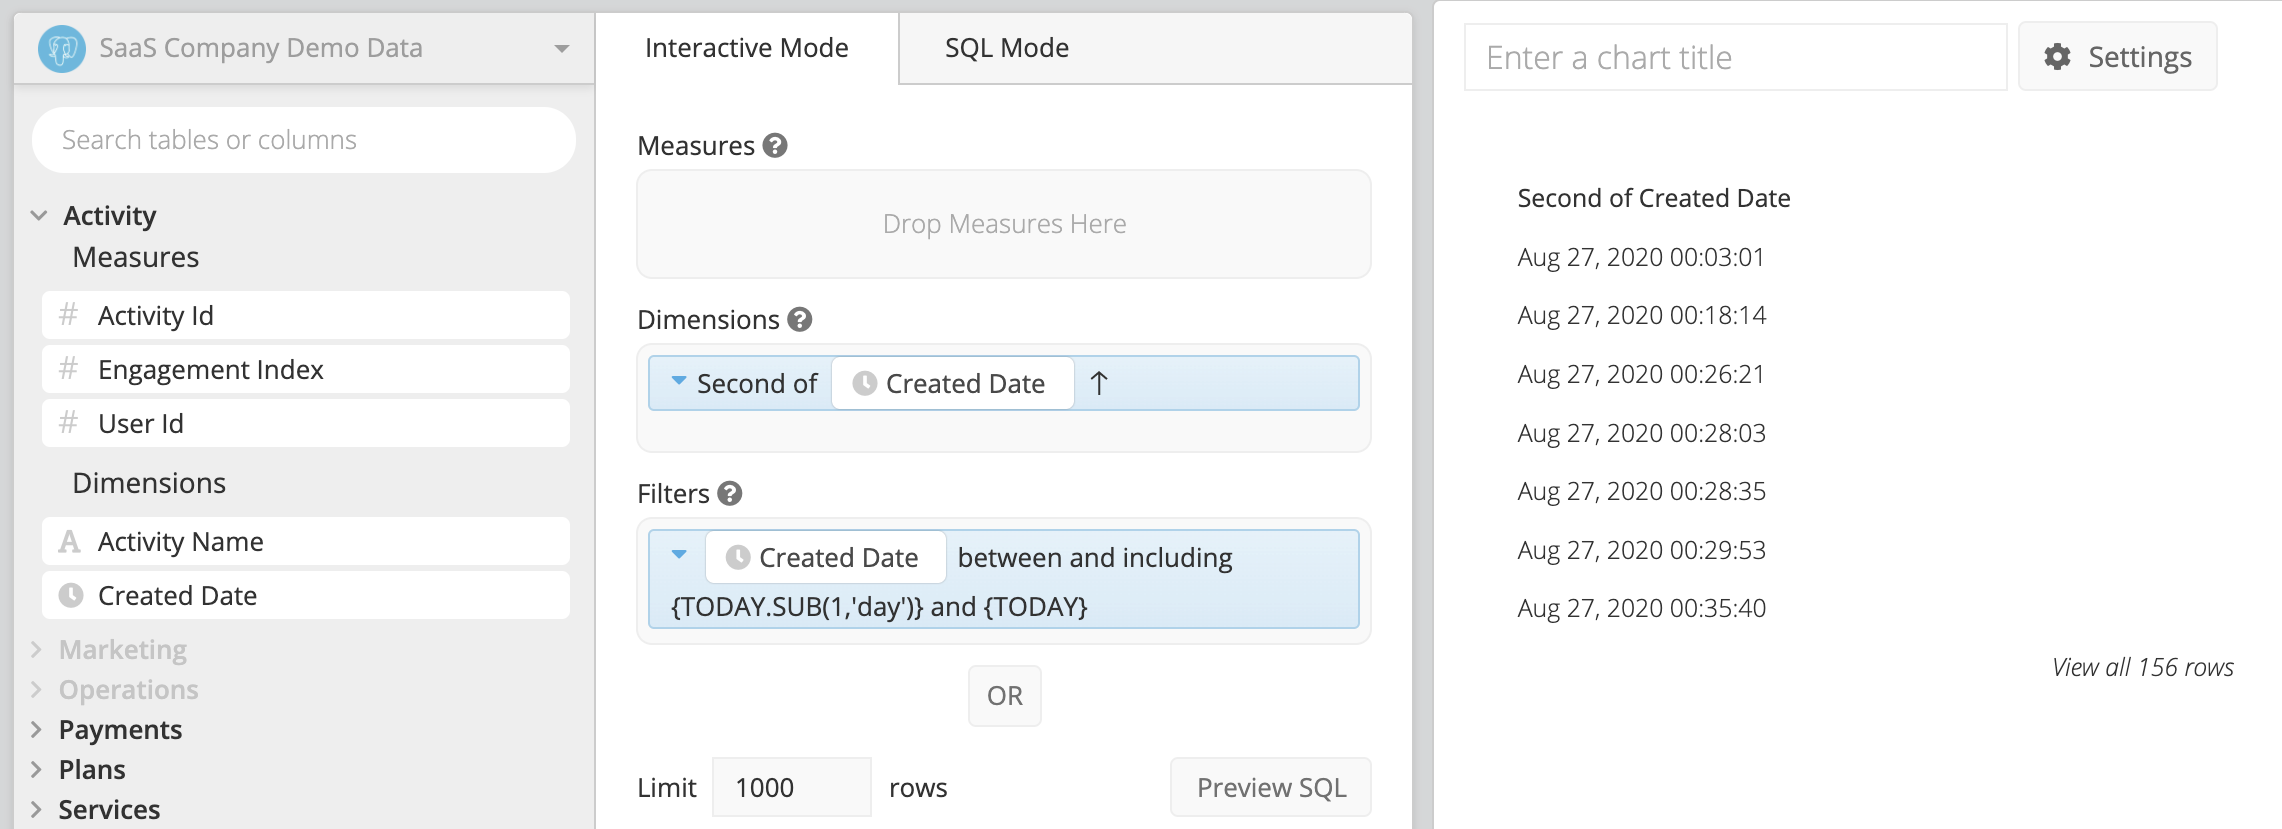
Continuing with the example mentioned earlier, if we were to use “between and including” and Relative Date Variables to get data from the last day, the time range of our chart would be from 12:00 AM August 17th to 11:59 PM August 18th. Now all data from August 17th would be included in our chart.
Visual Mode
To filter your data by full days, you can use the “between and including” filter operator and use our Relative Date Variables as the start and end dates for your date filter instead of absolute dates.
For example, if we want to look at the last full day, we’d use {TODAY.SUB(1,'days')} for the start date and {TODAY} as the end date for our date filter.
SQL Mode
Note: The syntax used for our examples is PostgreSQL syntax. The syntax and functions may vary depending on your data source type.
If you prefer to use SQL Mode, you can use the following condition, which uses Chartio’s Relative Date Variables and Datetime functions, in your WHERE clause, replacing date_column with your date/datetime column’s name:
WHERE ("date_column" BETWEEN DATE {TODAY.SUB(1,'day')} AND DATE {TODAY} + INTERVAL '1 DAY')
If you’d prefer not to use Chartio’s Relative Date Variables, you can use the datetime functions available for your data source. For example, you can use the CURRENT_DATE function for PostgreSQL:
WHERE ("date_column" BETWEEN CURRENT_DATE - INTERVAL '1 DAY' AND CURRENT_DATE + INTERVAL '1 DAY')