SQLite date and time functions in Data Explorer
Customizing date formats
As date and time can be broken down into individual components like month, day, year, hour, minute, etc., you can format your date or time values to only show the information you want within your charts.
You can use these modifiers in the Data Pipeline using the Custom Formula option in the Add Column or Edit Column Pipeline steps. If you want to use modifiers in your initial query against your data source, check your corresponding data source SQL syntax to make sure you’re using the correct modifier associated with that data source type.
| Format | Definition | Example |
|---|---|---|
| %d | day of month | 01-31 (up to 31 days) |
| %f | fractional seconds | 11.111 (SS.SSS) |
| %H | hour | 00-24 (24 hours) |
| %j | day of year | 01-366 (365 days, 366 if it’s a leap year) |
| %J | Julian day number | continuous count of days since the beginning of the Julian period |
| %m | month | 01-12 (Jan-Dec) |
| %M | minute | 00-59 (60 minutes) |
| %s | seconds | convert date/time value to seconds since 1970-01-01 |
| %S | seconds | 00-59 (60 seconds) |
| %w | day of week | 0-6 (where Sunday = 0) |
| %W | week of year | 00-53 (ISO WEEKS) |
| %Y | year | 0000-9999 |
You can use the modifiers listed above in format functions using the following SQLite syntax:
strftime('format',"date/time_column_name")
For example, if you have a column named “Second of Created Date” which includes information that’s too granular for my needs, you can refine it to only include the year, month, and day in your preferred order using the formula below:
strftime('%Y-%m-%d',"Second of Created Date")

For the most common variations like date or datetime, you can use functions that will apply the format to your whole column such as:
| Function | Equivalent strftime() |
|---|---|
| date(…) | strftime(‘%Y-%m-%d’,…) |
| time(…) | strftime(‘%H:%M:%S’,…) |
| datetime(…) | strftime(‘%Y-%m-%d %H:%M:%S’,…) |
| julianday(…) | strftime(‘%J’,…) |
Other things to do with dates and times
You can modify dates and times and do computations with them. You can append modifiers to any of the following functions: date(), time(), datetime(), and julianday(). The units below can be used as part of the formulas:
- NNN days
- NNN hours
- NNN minutes
- NNN.NNNN seconds
- NNN months
- NNN years
These modifiers can be used to modify your date or time. For example, you can use the following formula structure for date():
date("Column Name",'+interval unit','+interval unit')
In the screenshot below, we add one month and two days to the “Day of Created Date” column:
date("Day of Created Date",'+1 months','+2 days')

Note: The modifiers can also be negative values if you want to subtract values from your date or datetime columns. The second interval unit is also optional.
For additional math functions, Chartio has the following built-in functions available in the Pipeline using SQLite:
dateadd(date_string,amount,'unit')- Adds a time interval to a date or datetime.datesub(date_string,amount,'unit')- Subtracts a time interval from a date or datetime.datediff(date_string1,date_string2,'unit')- Calculates the difference between two dates or datetimes.unitis optional; the formula will default to days if no unit is specified.datepart(date_string,'unit')- Extracts a part of the date string.
The units available to be used within the above functions are:
- day
- week (
datediff()only) - month
- year
- hour
- minute
- second
Create a granular date range filter
There may be a situation where a more granular date range selection including a specific time of day is required. This example uses our PostgreSQL Dundersign Demo Data data source. In PostgreSQL, depending on your data, you may have a datetime field you’d like to use to filter your data.
When you drag a date field to the Filters, a dropdown of options is presented but with the absence of a time selection. You can instead filter using a timestamp in the Data Pipeline by following the steps below:
- Open the Users table and drag Id to the Measures field.
-
Next, drag the Created Date column to the Dimensions field. If you want to filter between a specific time, you need to change the time bucket of the datetime column. In this example, select Second for the time bucket. Click Ok then Run Query.

-
Scroll down to Pipeline, click + Add Transformation and select Filter Rows from the list. You can then set your precise filter conditions here using the Custom Input option.
In this example, we filter to include data for a time greater than
2020-11-06T01:00:00and less than2020-11-06T02:59:59. This final filtering step depends on your chart requirements.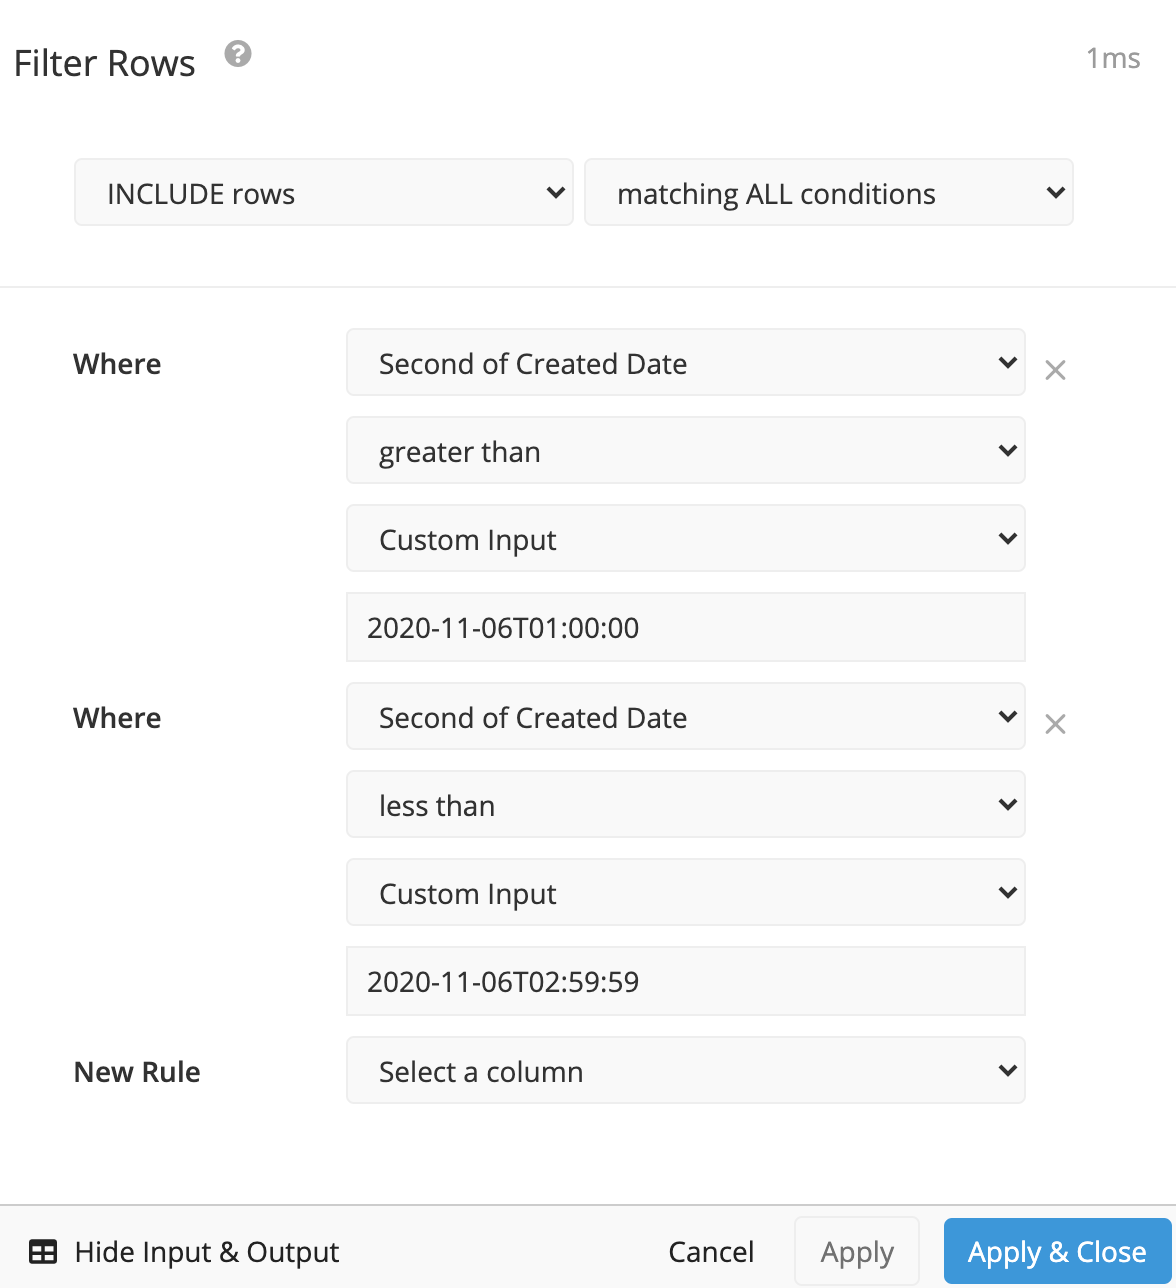
You may need to hide the initial Second of Created Date column or add a Group Rows step if there are duplicate values.
- If you only needed the date column to filter your results but don’t need to include the date column in your final result set, add a Hide Columns Pipeline step after completing this.