Calculate a percentage in Data Explorer
Percentages can be used to gain valuable insight into the affects a portion has on a total. They’re heavily relied upon to determine and evaluate KPIs for an organization and guide operations to improve your overall business performance.
In this example, using the Dundersign Demo Data data source, we divide our cancelled organizations over our total organizations to calculate our churn rate. Churn rate is a common metric used by SaaS companies to determine how effectively they’re retaining their customers.
-
First, create a dataset to calculate the number of customers who have not cancelled. To do this, count the number of organizations where the Starting Paying Date is not null and the Stopped Paying Date is null.
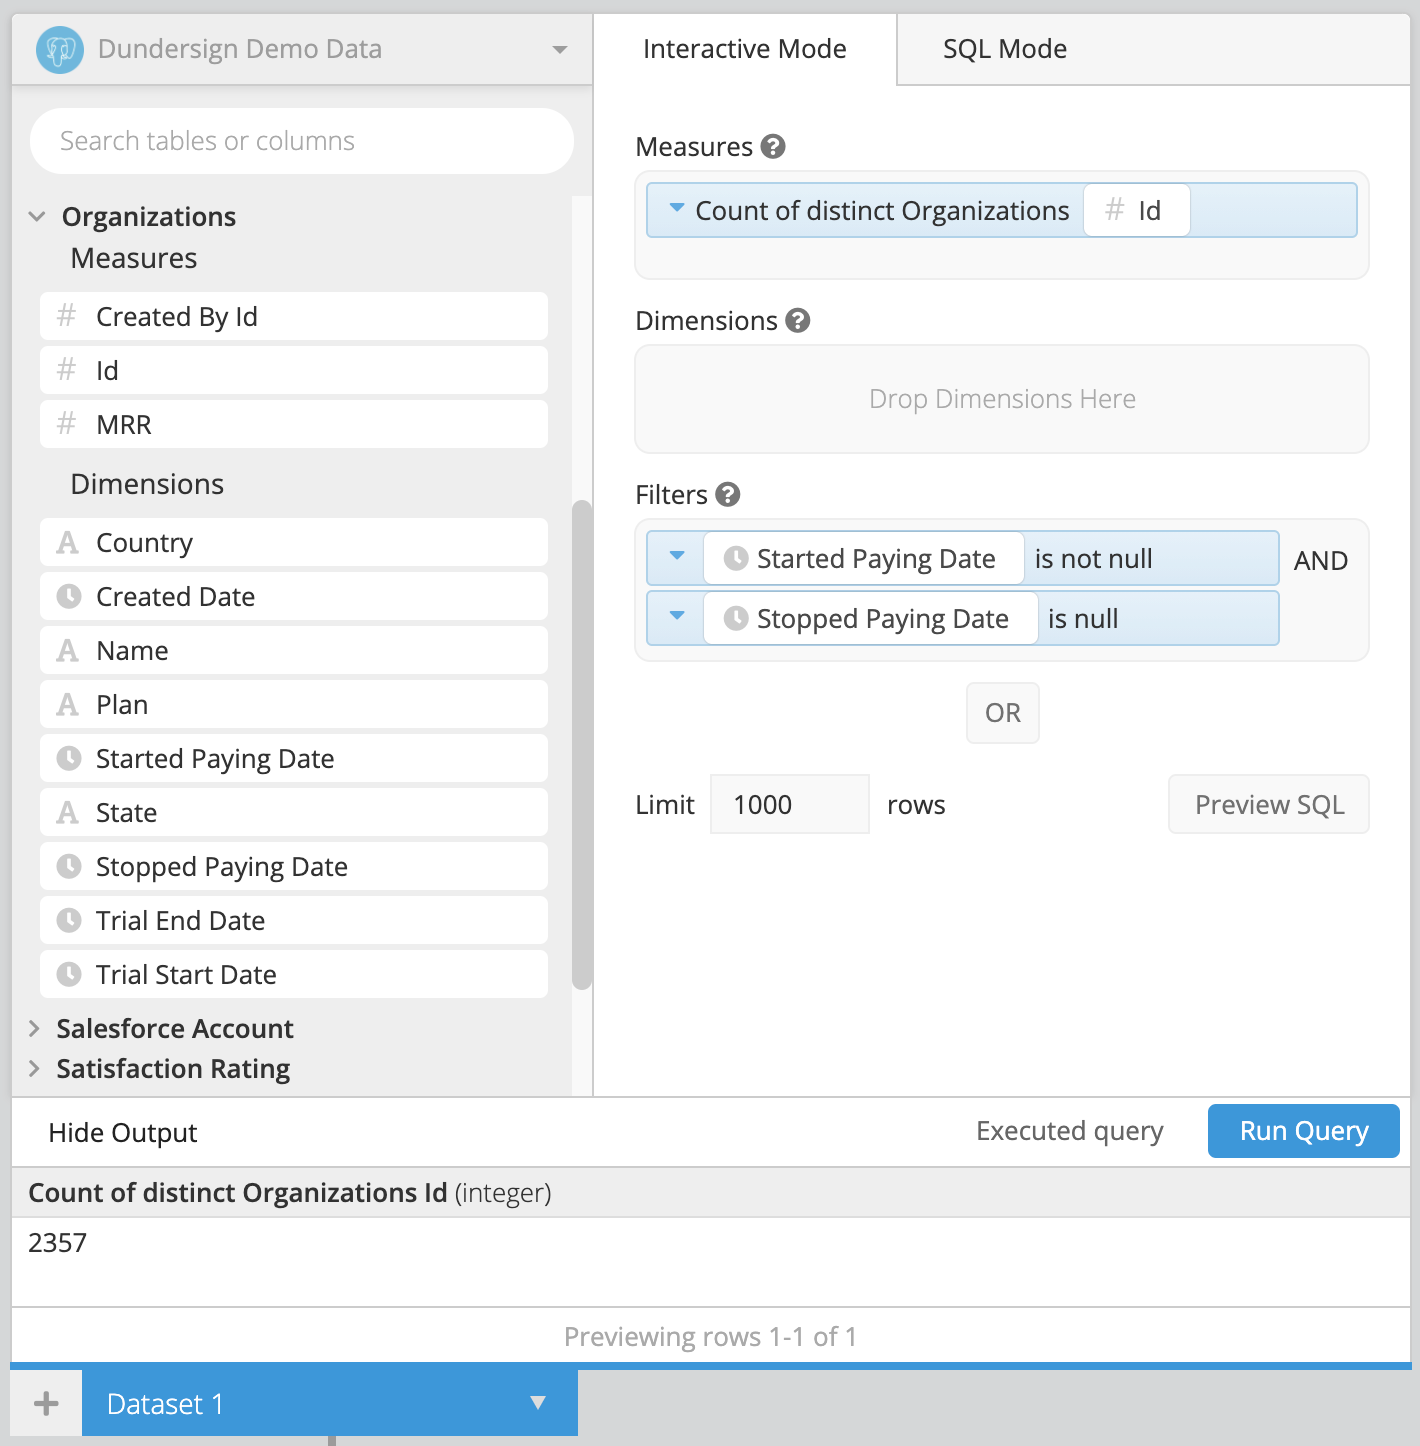
-
Create a second dataset to get the count of subscriptions that have cancelled. To achieve this, count the number of organizations where both the Started Paying Date and the Stopped Paying Date are not null.
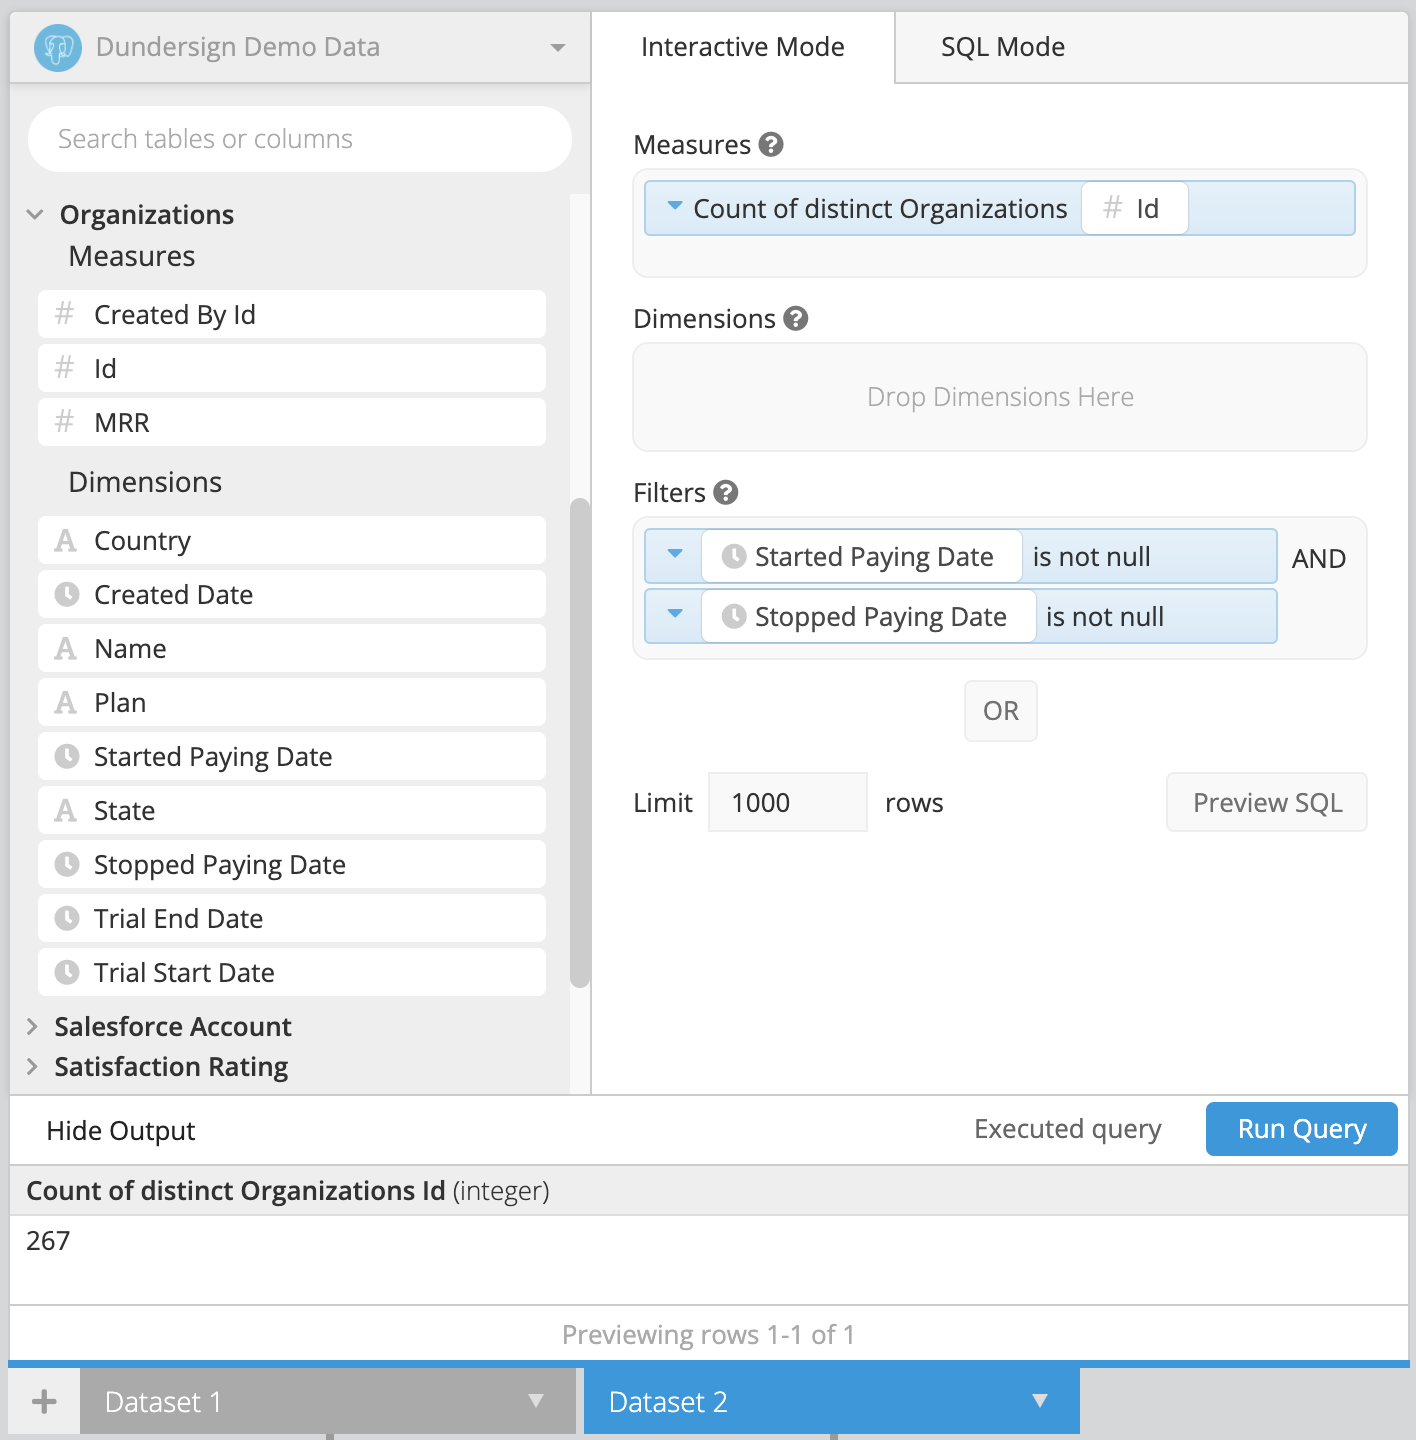
-
After creating the two datasets, make sure to use a Cross Join when merging them.
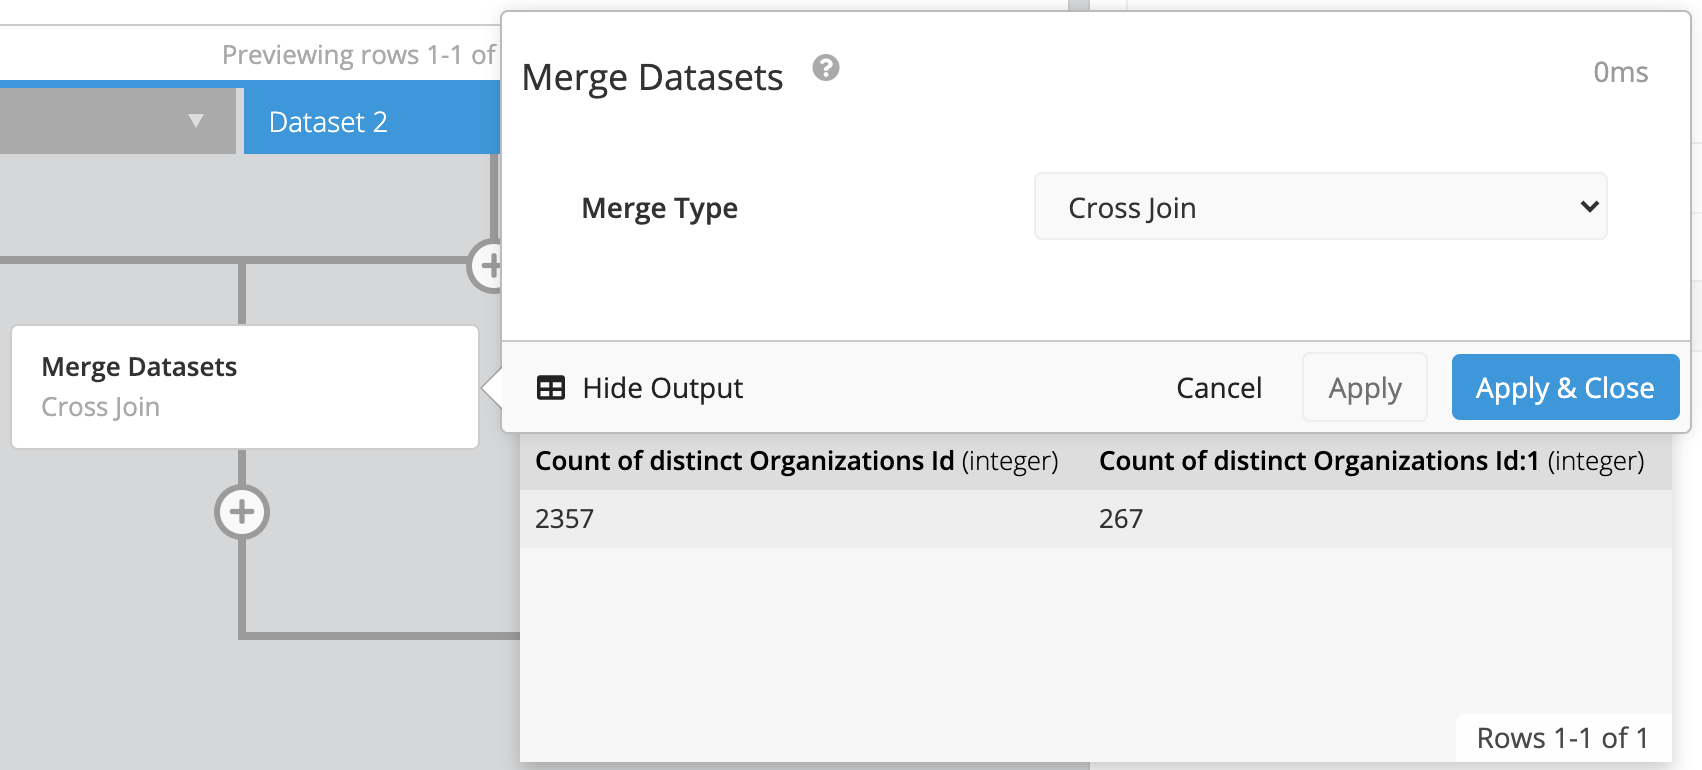
-
Rename the column from Dataset 1 to
Active Organizationsand the column from Dataset 2 toCancelled Organizations.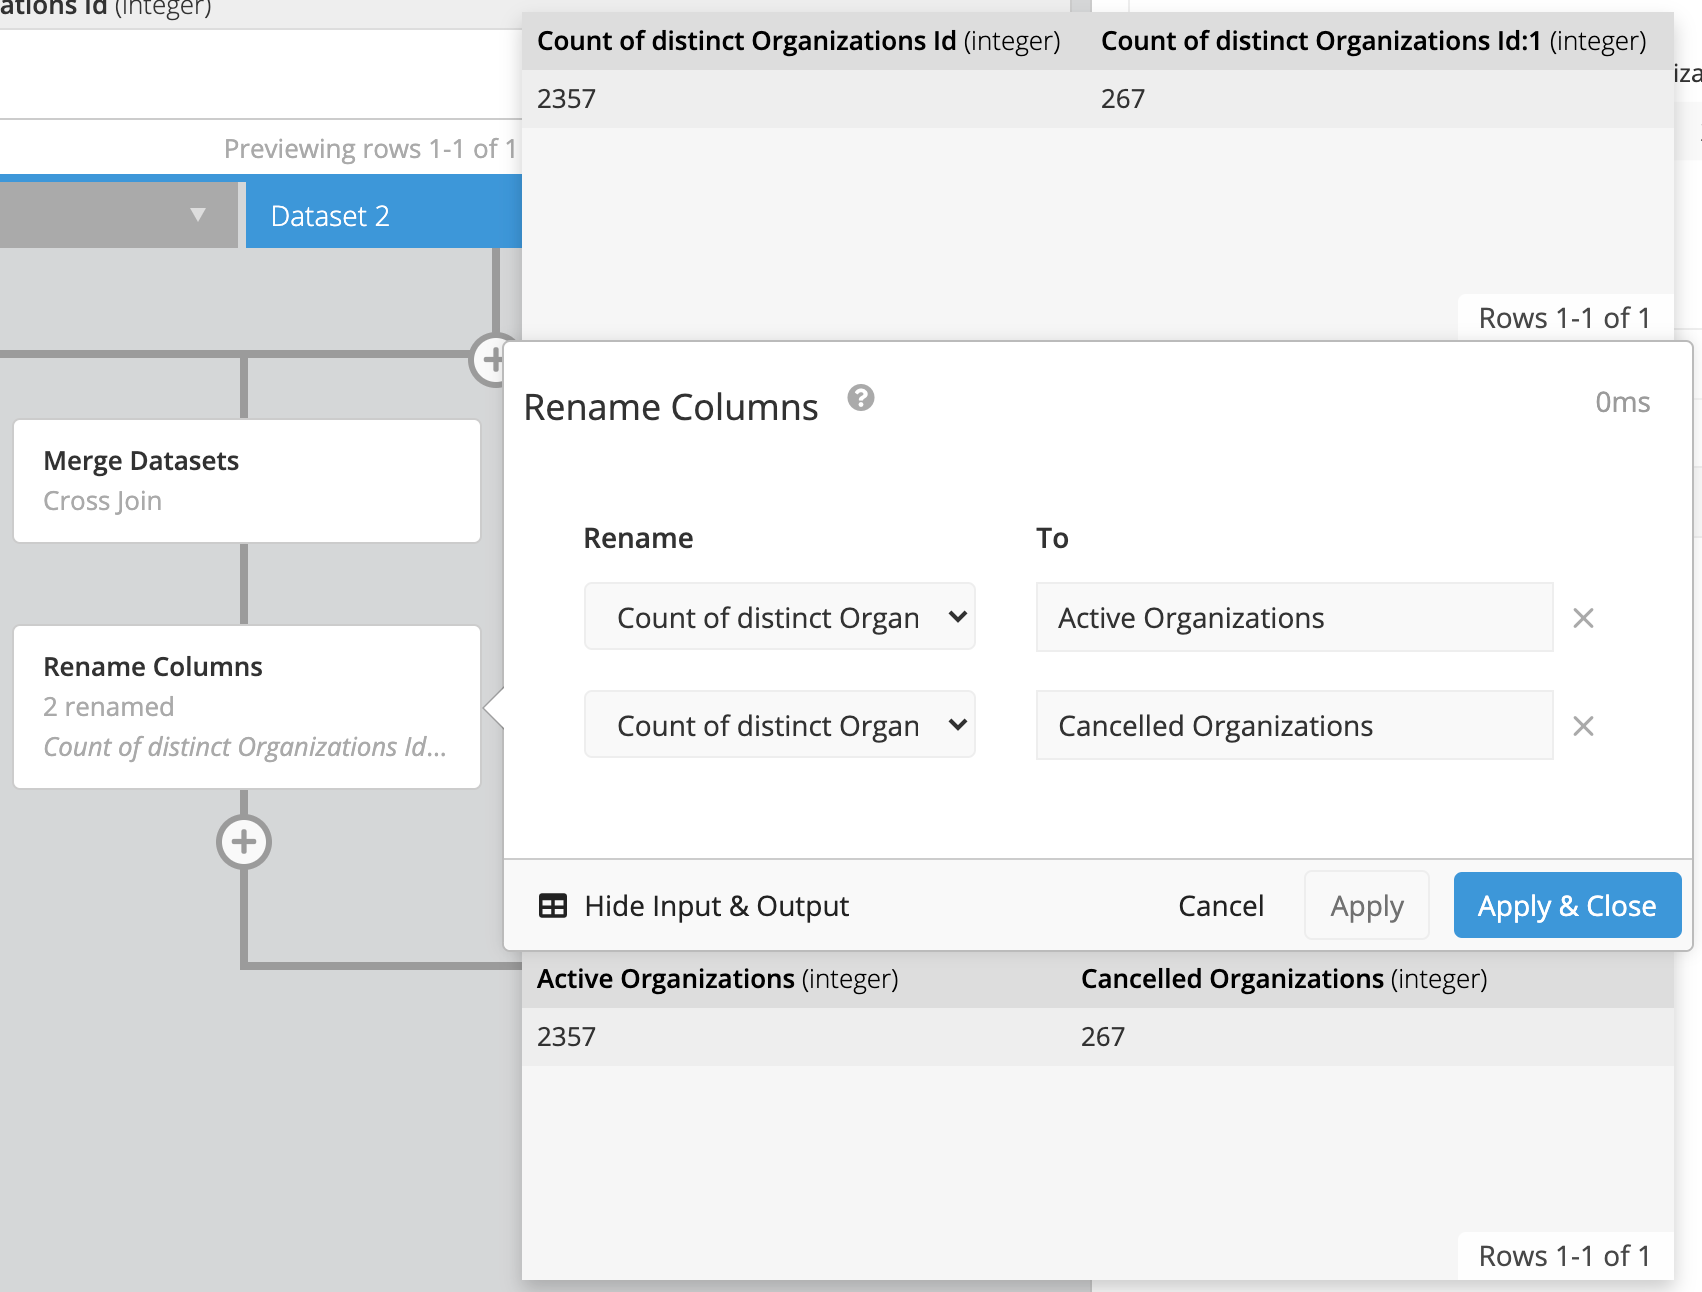
-
In the Data Pipeline, click the plus icon > Add Column. Give this new column a name (e.g.,
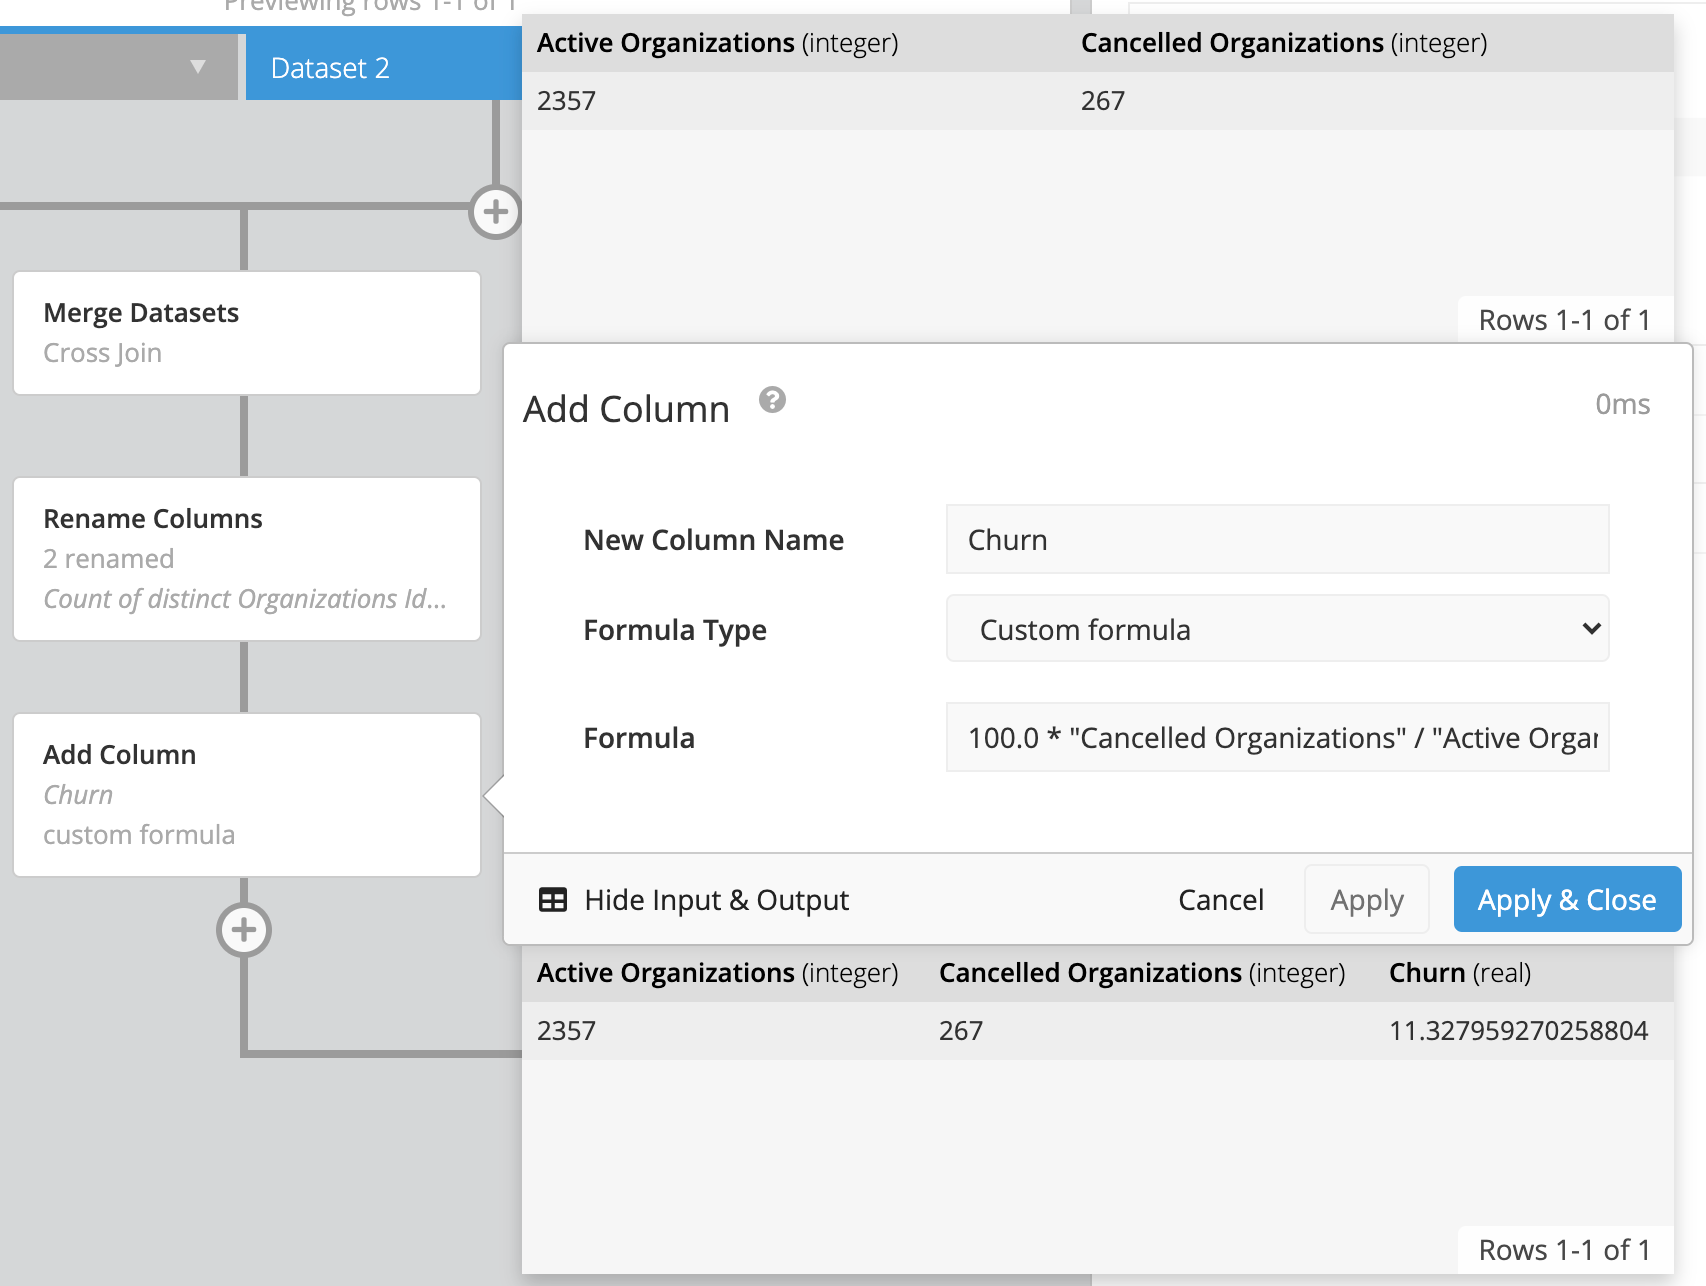
Churn), choose Custom formula as the Formula Type, then enter the following percentage formula:100.0 * "Cancelled Organizations" / "Active Organizations"If you want to round your percentage to two decimal points, you can also use the SQLite
round()function; the formula will look like this:round(100.0 * "Cancelled Subscriptions" / "Active Subscriptions", 2)where
2is the number of decimal places.Click Apply & Close.
Note: If your column values are integers and you’d like your results to have decimal precision, be sure to multiply the numerator by
100.0to convert the column to a float data type. This converts the top value to a decimal before the division step and ensures your results are in decimal form.
The final result set should look like this:
How to Troubleshoot Percent Change
If you’re using the Percent Change formula in your Data Pipeline, you may notice that if the previous row is 0, the percent change returns a NULL result. Don’t worry—this is expected, and we’ll help you deal with those situations.
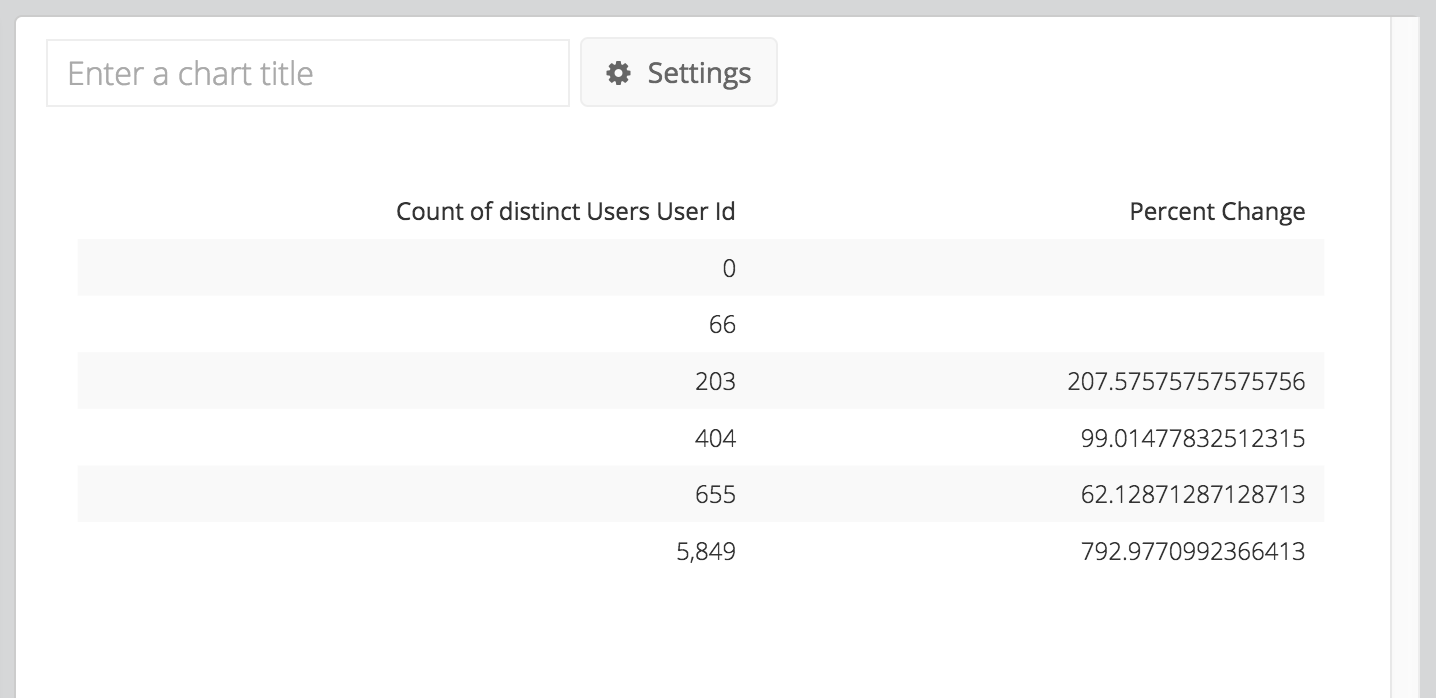
Our Data Pipeline runs on SQLite, which adheres to Postel’s Rule. The default behavior when dividing by zero is to return NULL rather than throw an error when dividing by zero (see SQLite documentation for more information). This lines up with the generally accepted principle that the concept of percentage change has essentially no meaning when starting from zero.
There are several articles online showing potential workarounds. In Chartio, however, one option is to add an Edit Column step after the Percent Change step to denote the percent change doesn’t apply here. You would select Custom formula as the Formula Type and add the following CASE statement to it, replacing Percent Change with the name of your column:
case when "Percent Change" is null then 'N/A' else "Percent Change" end