Area Chart Settings
| General | Axis | Color |
| Series | Drilldown | Annotation |
General
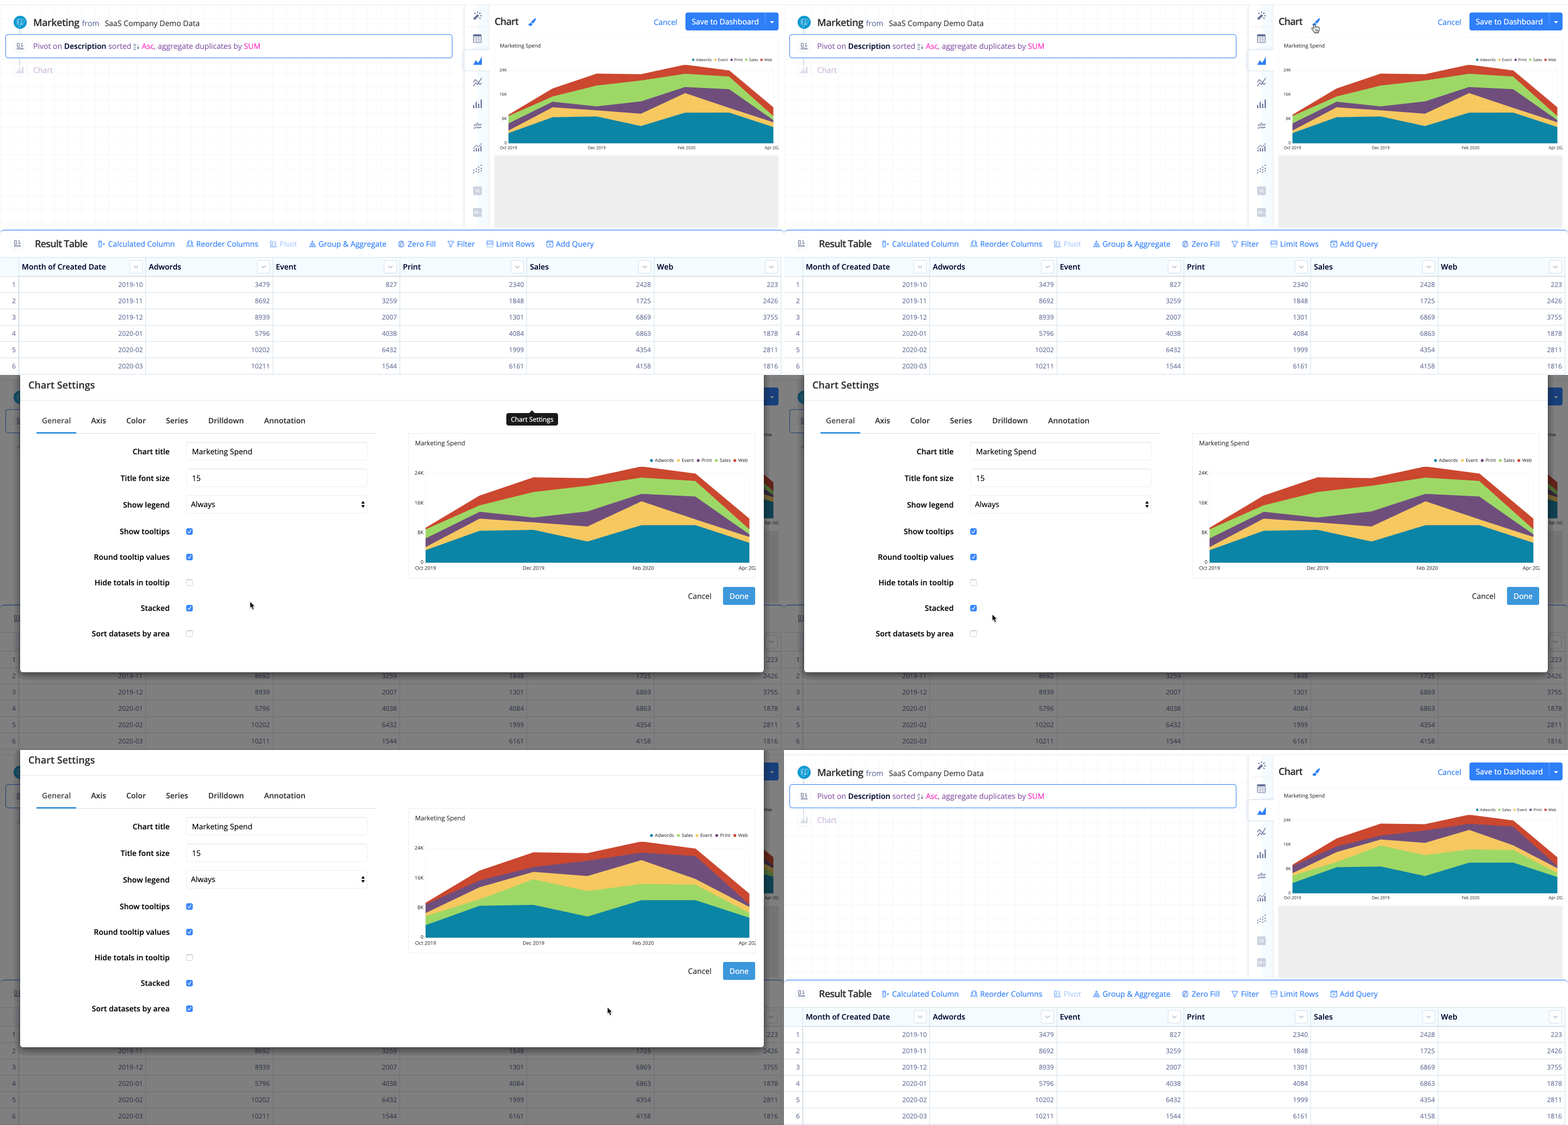
“Chart title”, “Title font size”, “Show legend”, “Show tooltips”, and “Round tooltip values” can be found in the General section of our Chart Settings page.
- Hide totals in tooltip
- Available when Show tooltips is selected
-
When selected, it hides the Total value, which is only displayed when Stacked is selected
- Stacked
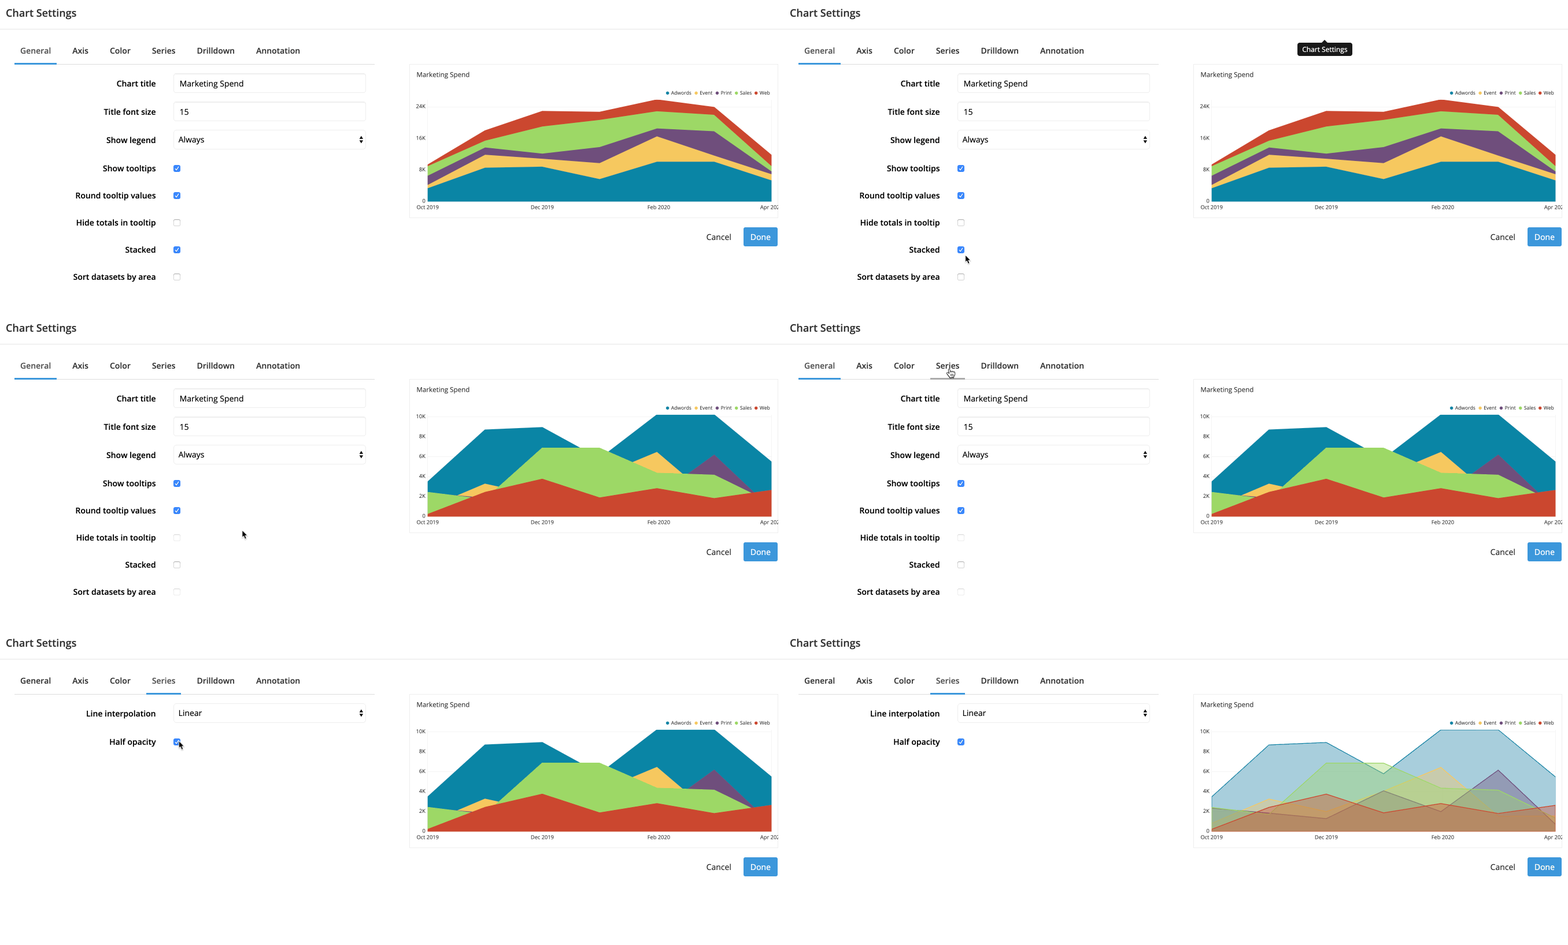
- When selected, stacks each Area layer. This gives you a better understanding of how each group’s value contributes to the Total value at any given point
-
Note: When Area charts are unstacked, information may be hidden by other layers. To make the data more visible for unstacked Area charts, you can select Half opacity under the Series tab.
- Sort datasets by area
- Editable when Stacked is selected
-
Sorts the stacked Area layers from most to least area, where most is at the bottom and least is at the top

Axis
X Axis
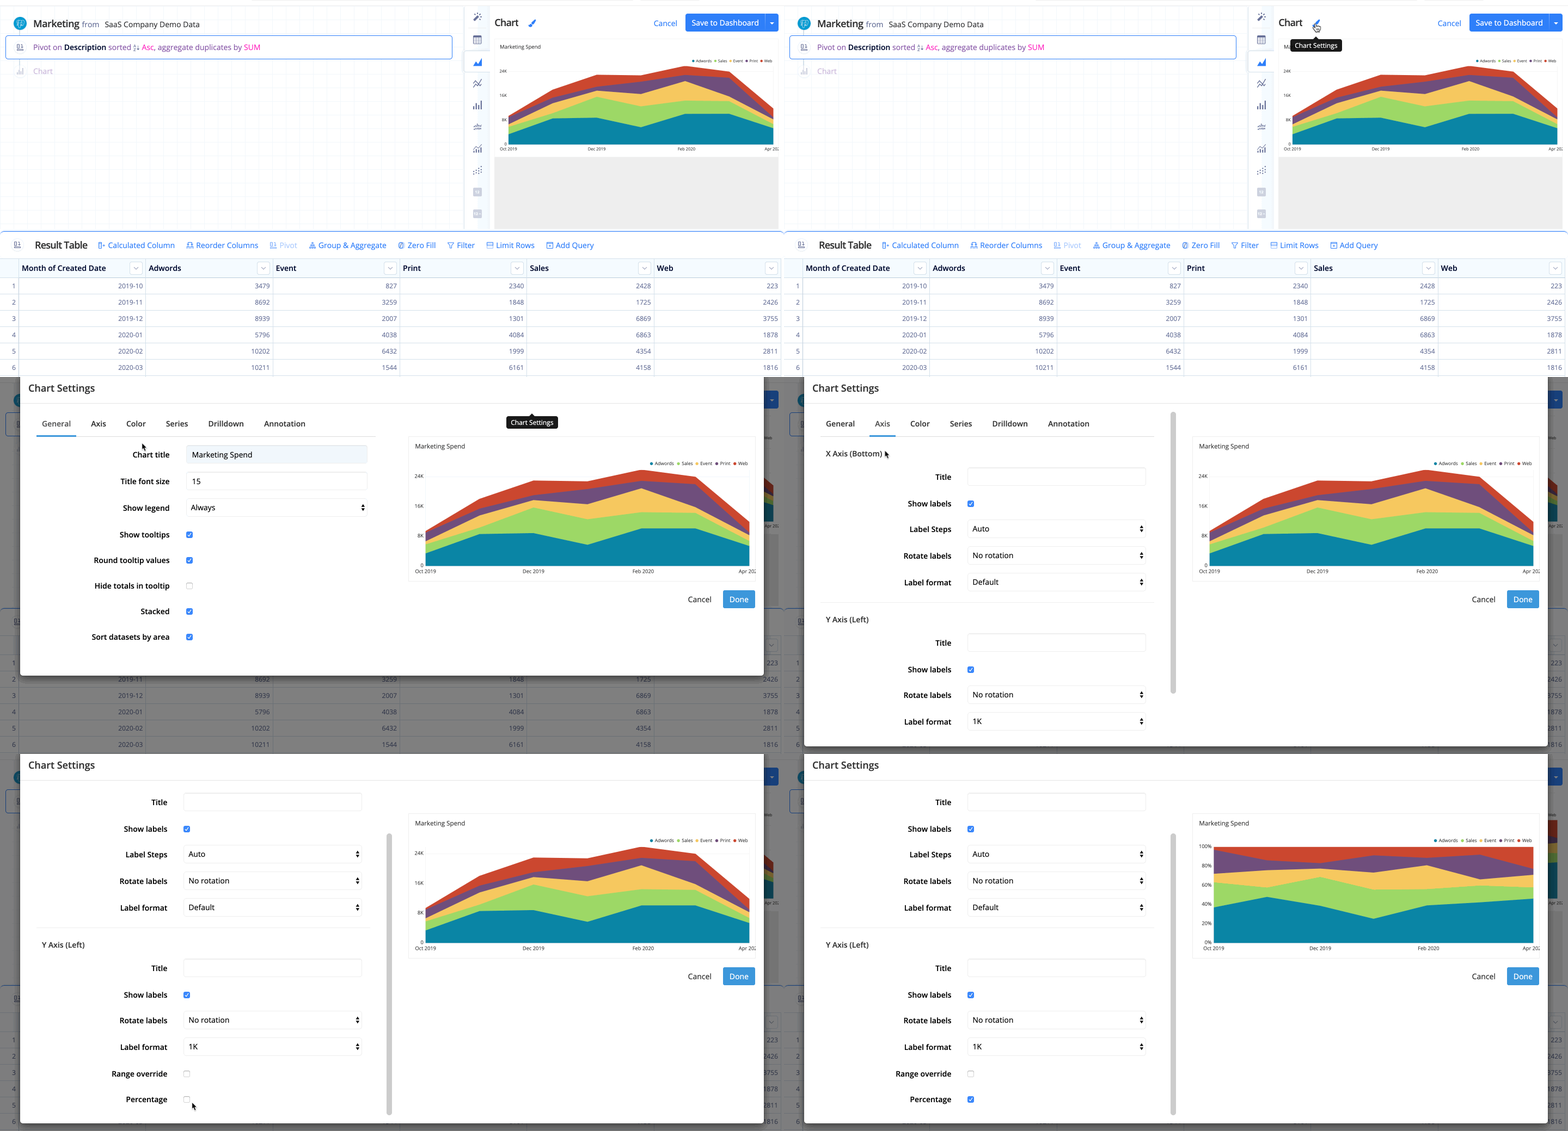
“Title”, “Show labels”, “Label steps”, “Rotate labels”, and “Label format” can be found in the X Axis section of our Chart Settings page.
Y Axis
“Title”, “Show labels”, “Rotate labels”,” Label format”, and “Range override” can be found in the Y Axis section of our Chart Settings page.
- Percentage
- Changes your y-axis to show percentages
-
Charts with a percentage axis are sometimes called 100% stacked charts and are useful for displaying ratios without focusing on individual values.
-

Color
“Background color” and “Use custom colors” can be found in the Color section of our Chart Settings page.
Series
- Linear interpolation
- Choose the type of interpolation for your chart:
- Linear: Uses the least number of data points, resulting in more jagged lines
- Smoothed: Uses more data points than Linear interpolation, resulting in smoother lines
- Cubic: Uses the more data points than Smoothed interpolation, resulting in more precise smooth lines
- Half opacity
- Reduces the opacity of area layers to 50%, making them more transparent — especially helpful for Stacked Area charts

Drilldown
Check out Drilldowns for more information on this tab.
Annotation
Check out the Annotation section from the Chart Settings page for more details.