Count distinct totals and percentages in Data Explorer
In this example, we create a Table chart using our Dundersign Demo Data data source to compare the number of distinct users per month over the last six months and include the percentage each month’s count contributes to the six-month total.
-
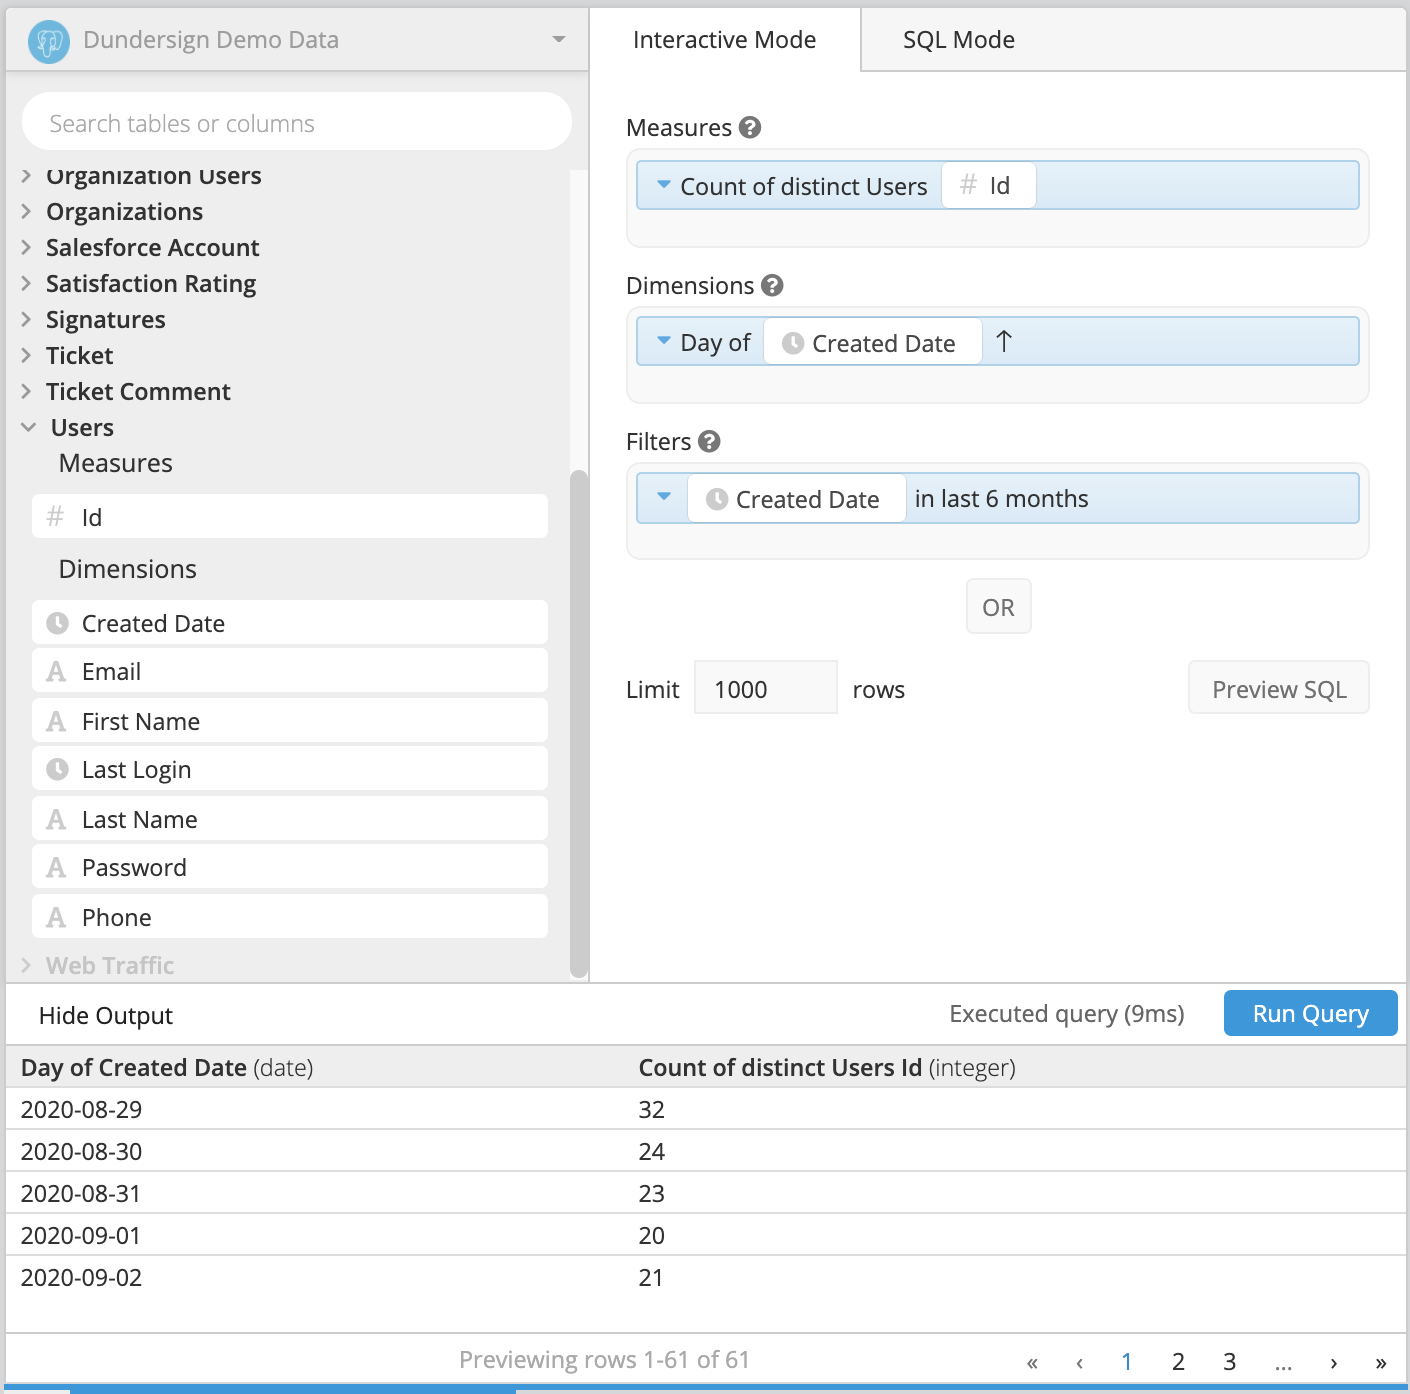
Start with the initial query. From the Users table, drag Id into the Measures field and Created Date into Dimensions. Keep the Aggregation for Id as Count of distinct and change the time bucket of Created Date to Month of.
Also drag Created Date to the Filters field, select last N months as the filter operator, and use 6 for the value to get data from the last six months.
-
Click the arrow next to the name of Dataset 1 and click Clone to duplicate it. Delete the column in the Dimensions field.
-
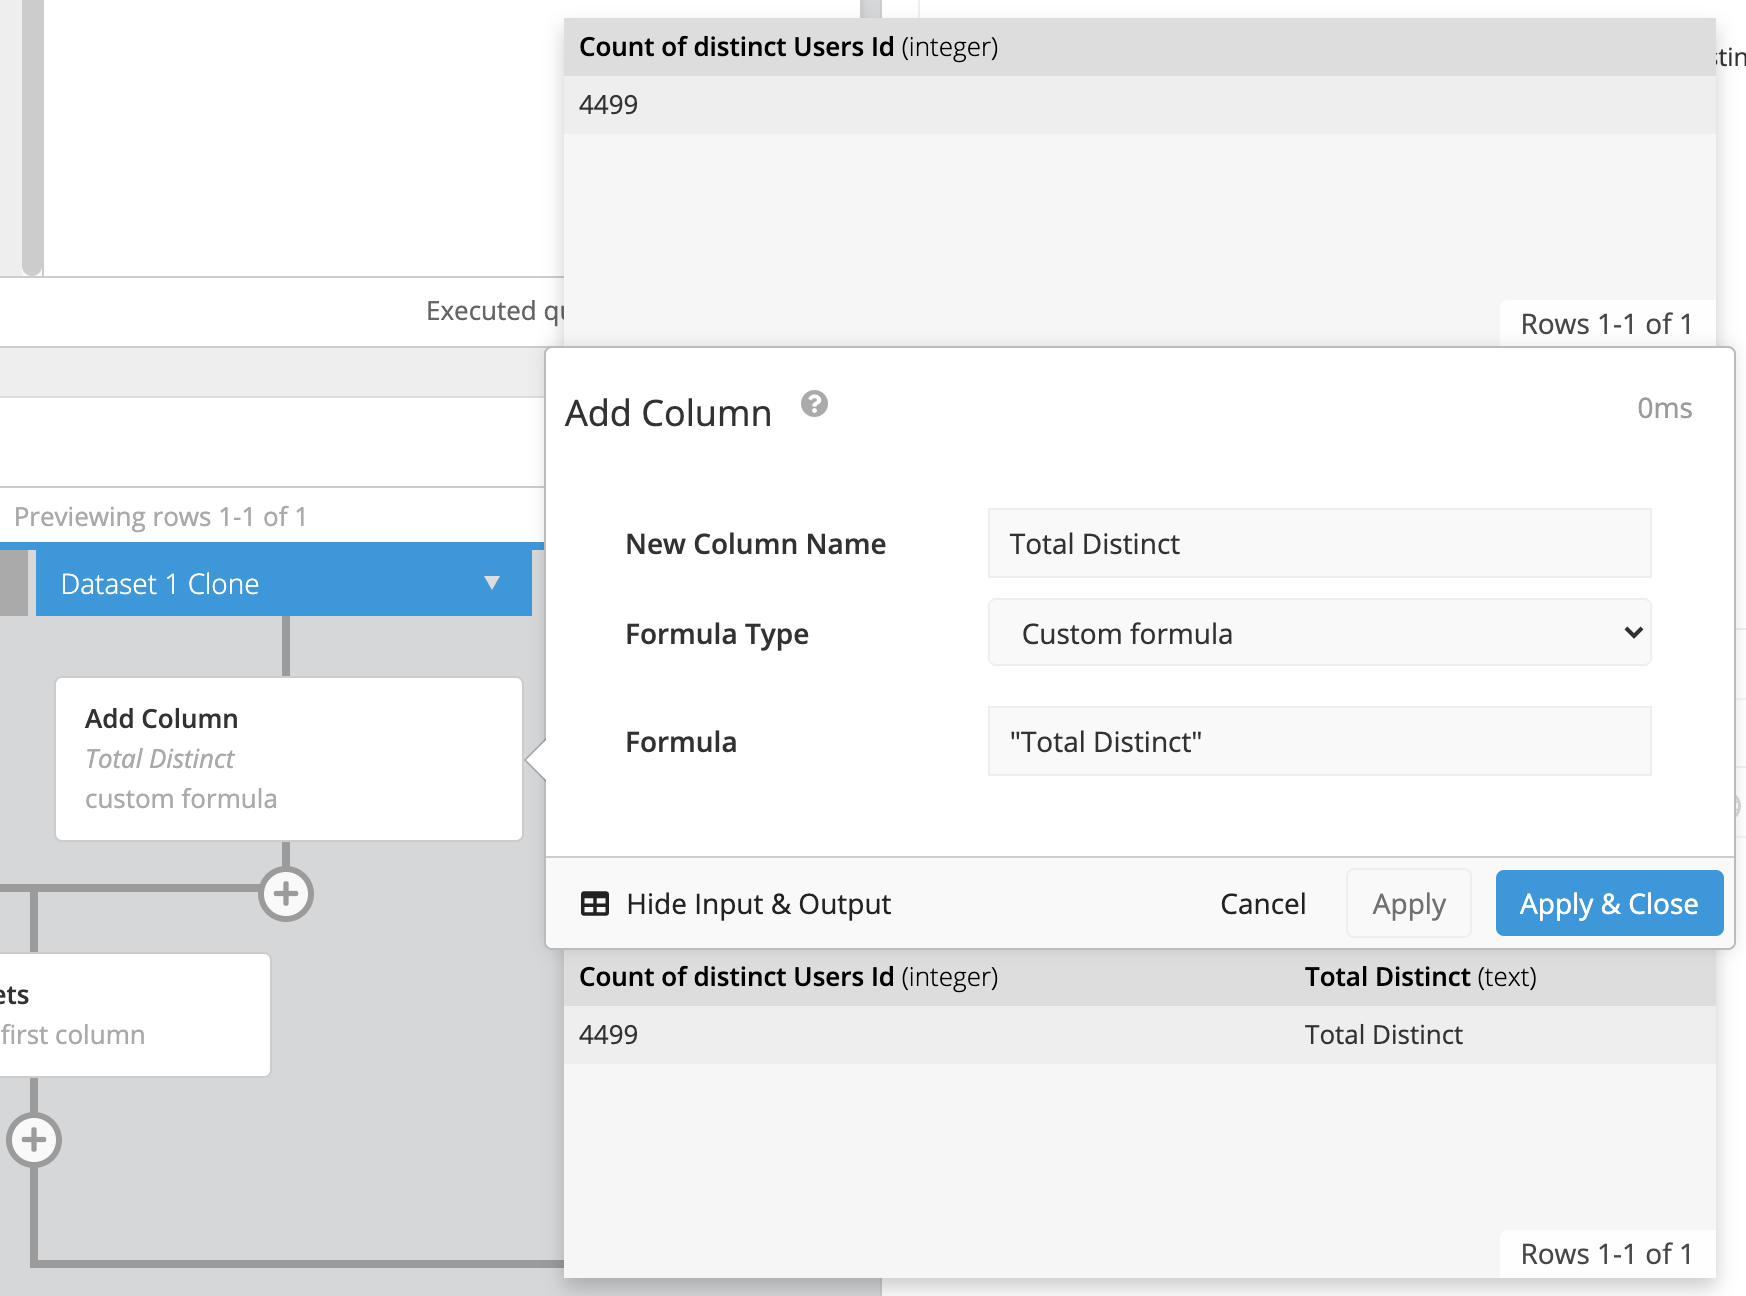
In the Data Pipeline, click the plus (+) directly under Dataset 1 Clone and add an Add Column step to the Dataset 1 Clone. Make sure you clicked Run Query before trying to add the Pipeline step!
Name this new column
Total Distinct, select Custom formula for the Formula Type, and enter the following for the formula:"Total Distinct"Click Apply & Close.
-
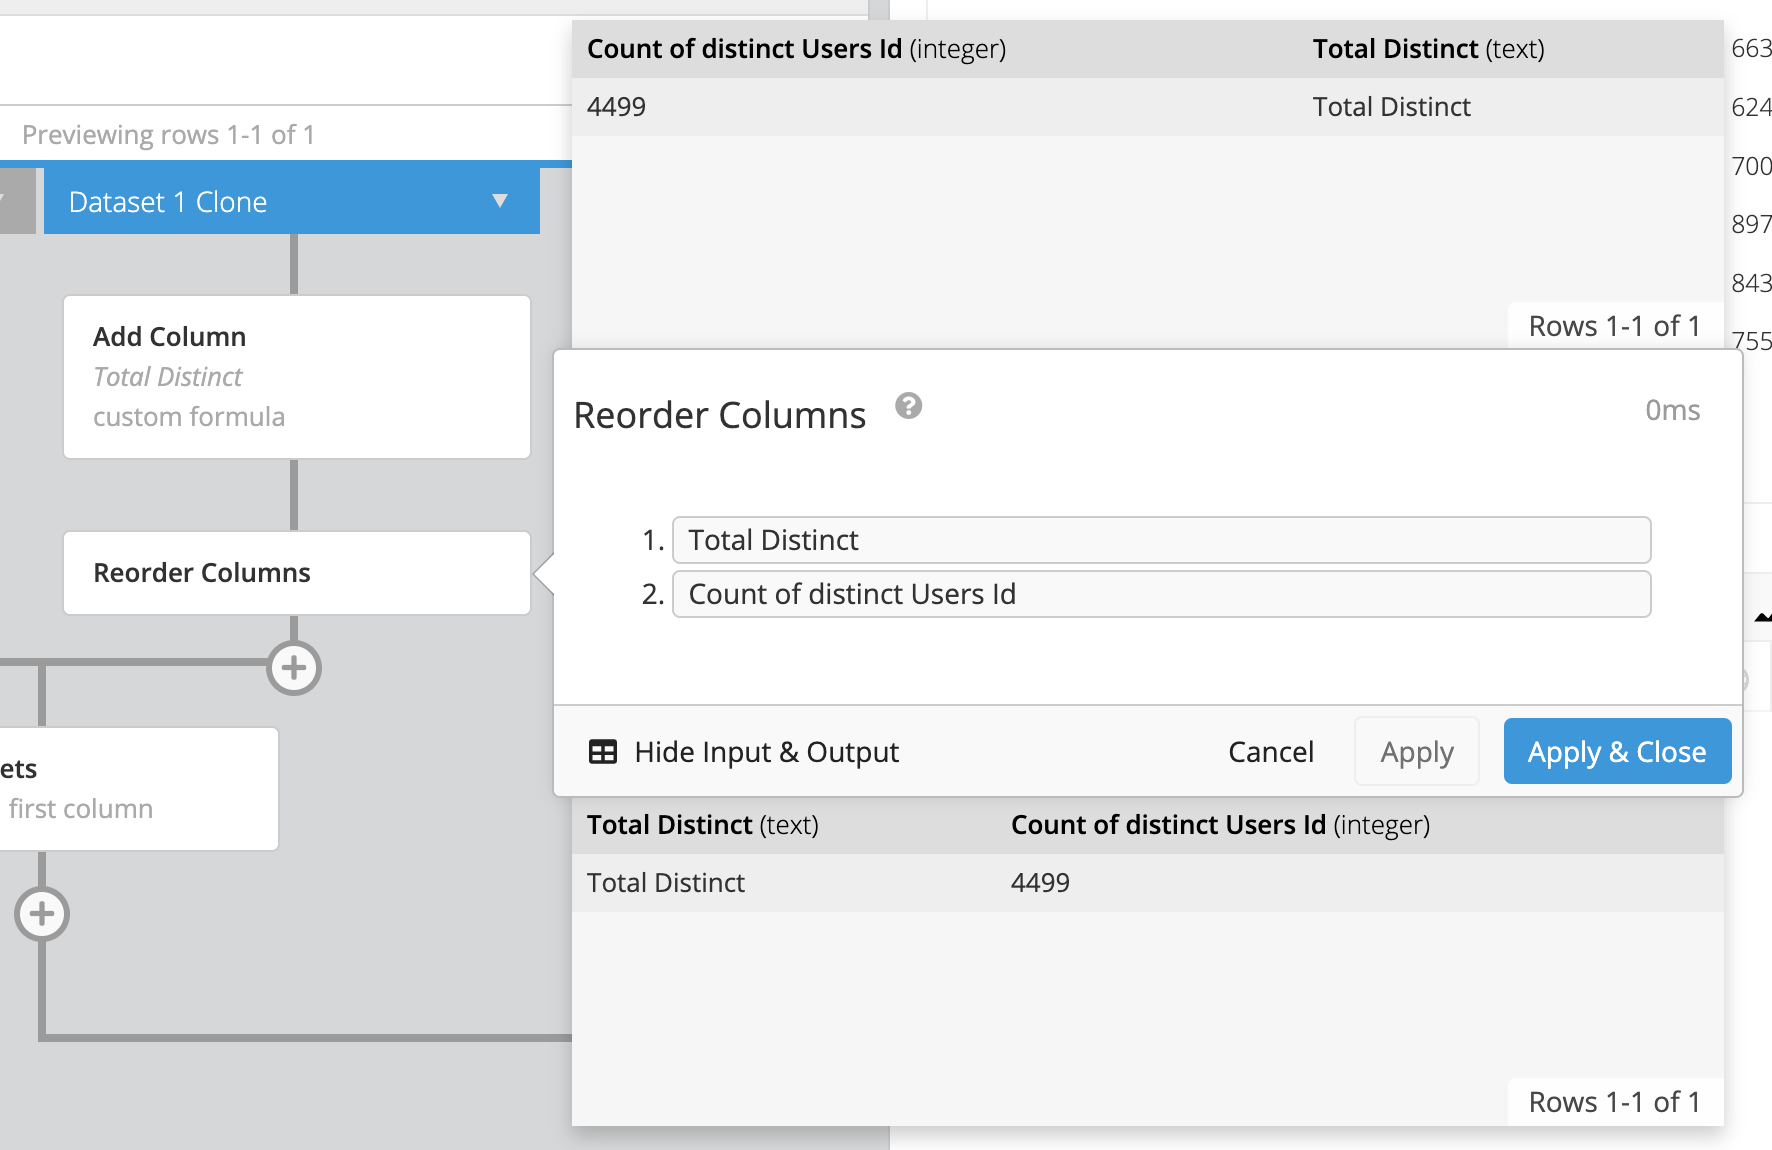
Still applying to Dataset 1 Clone, add a Reorder Columns step to make Total Distinct the first (i.e., leftmost) column.
-
Click the plus (+) icon under the Reorder Columns step and add another Add Column step. The name you give to this new column doesn’t matter too much since you’ll end up hiding it later on. Again, choose Custom formula and use
"Count of distinct Users Id"as the formula. If you didn’t rename any of the columns, it should pop up as you start typing!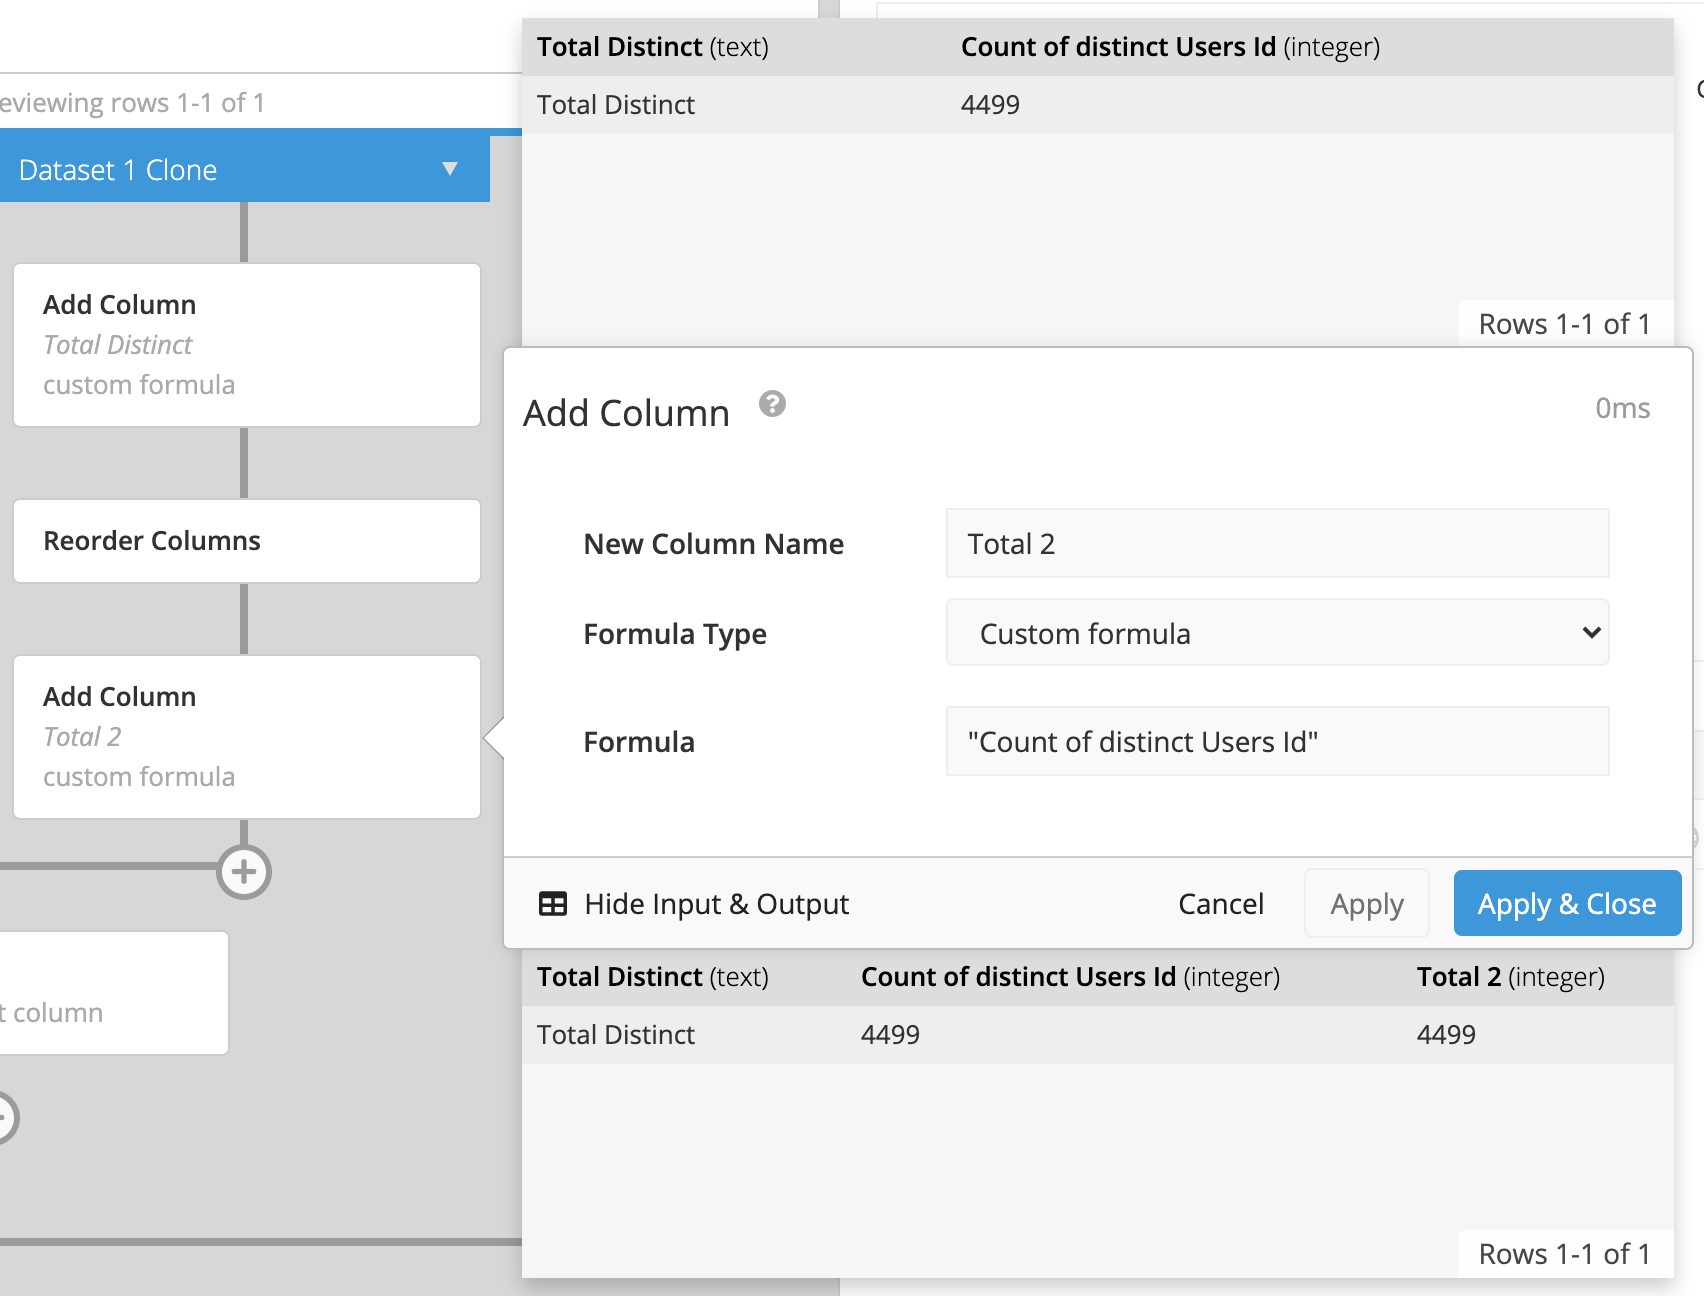
-
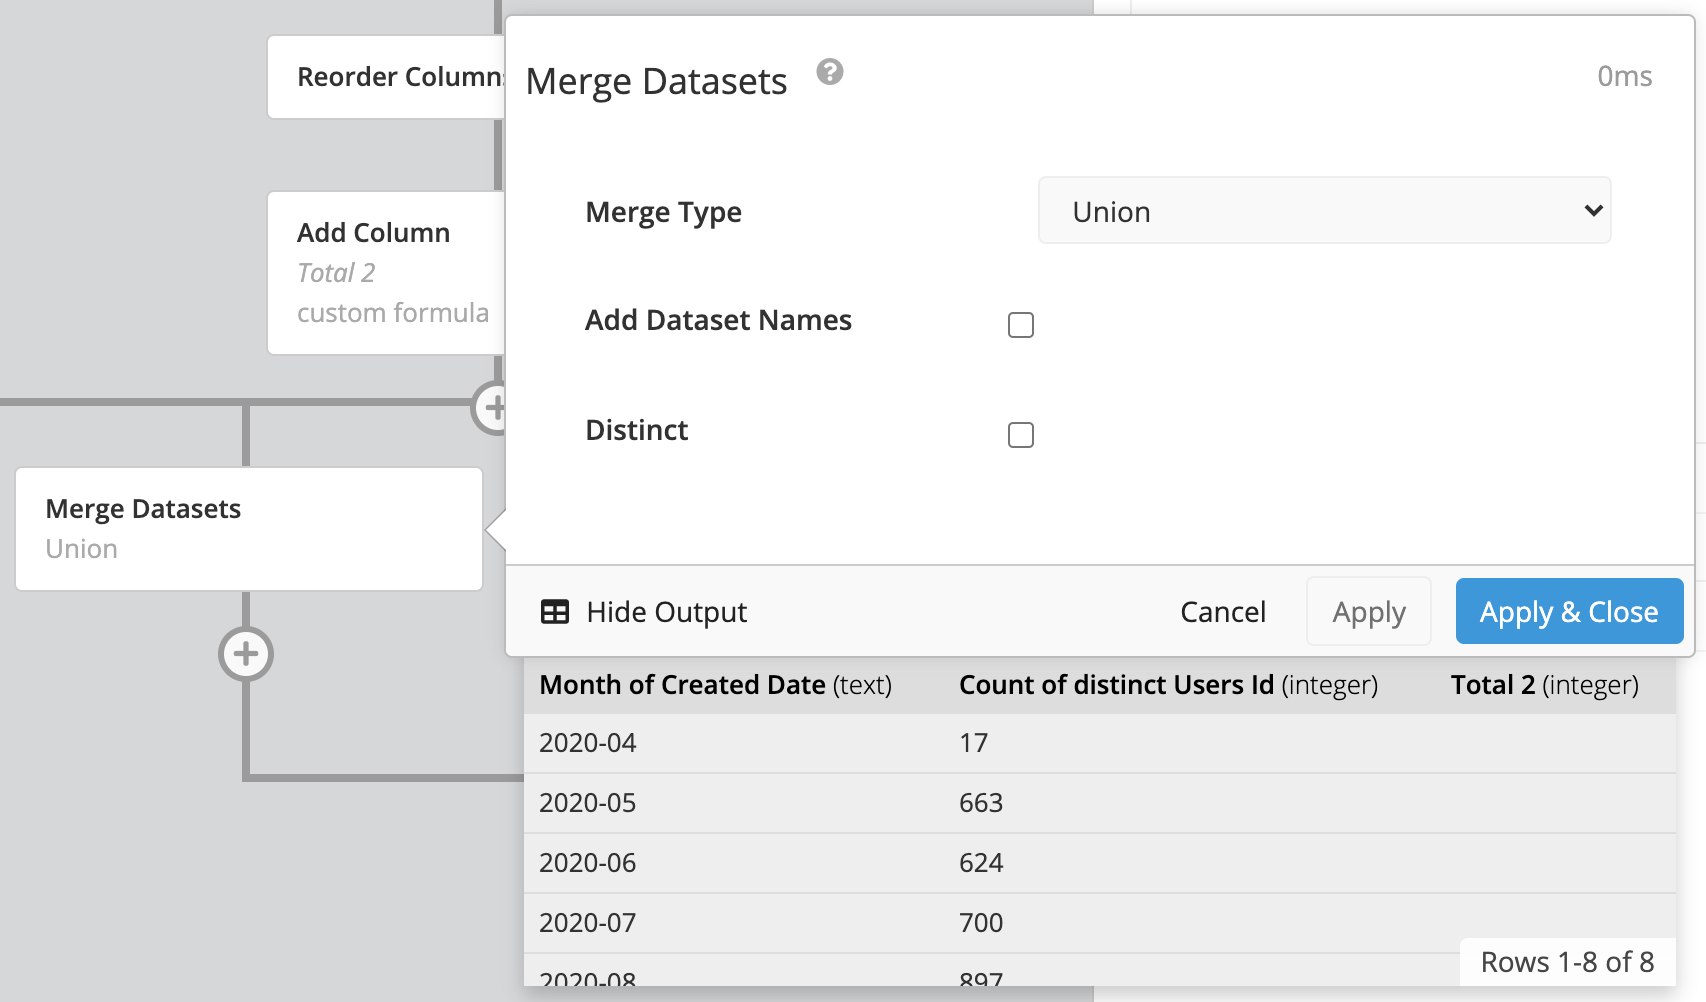
In the Pipeline, click Merge Datasets and change the Merge Type to Union.
-
Below the Merge Datasets step, add another Add Column step. Name this new column
% of Total, select Aggregation for the Formula Type, Total 2 (or whatever name you gave to the column in Step 5) for the Input Column, and SUM for the Aggregate Function. Click Apply & Close.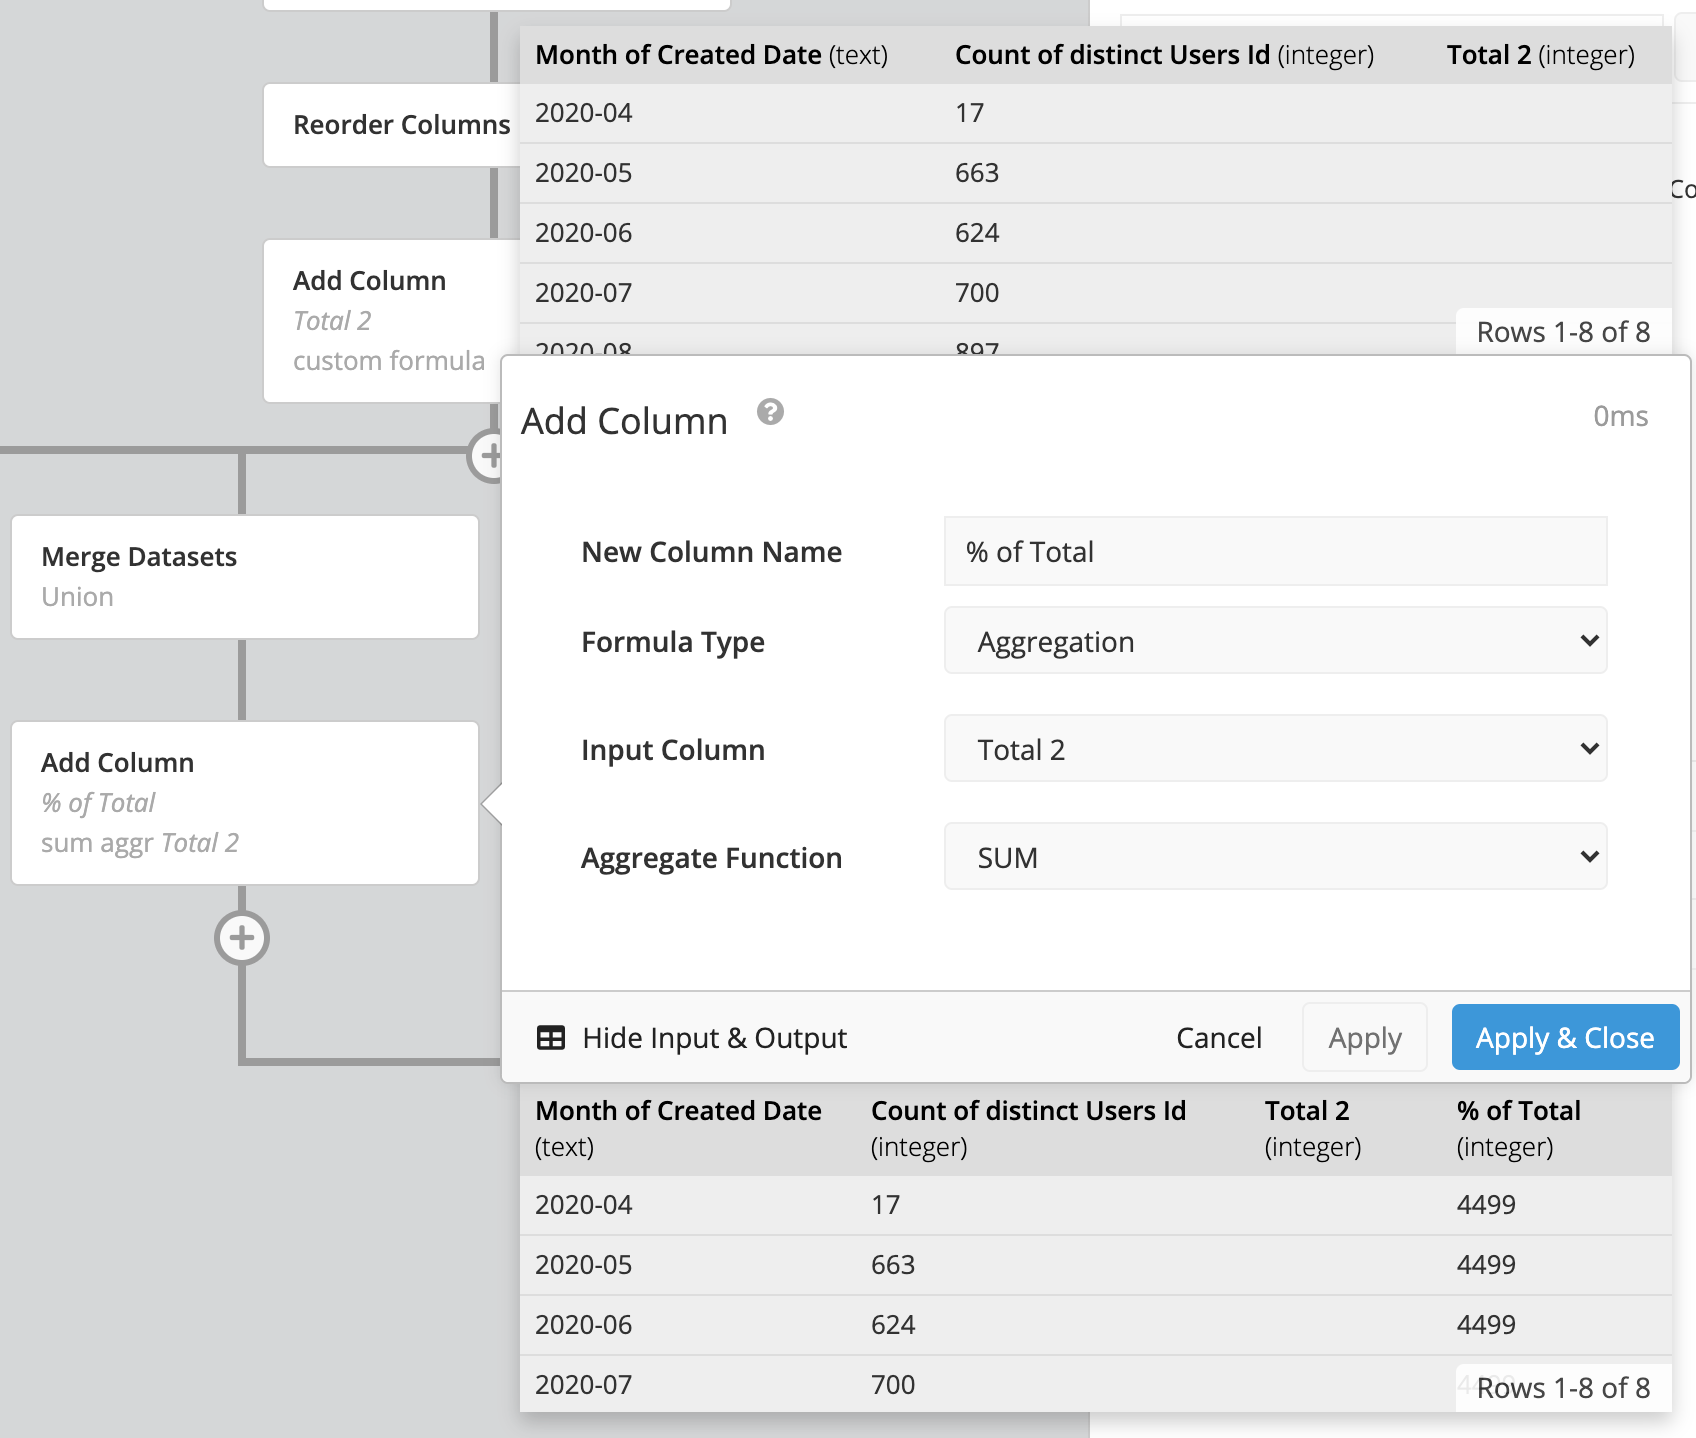
-
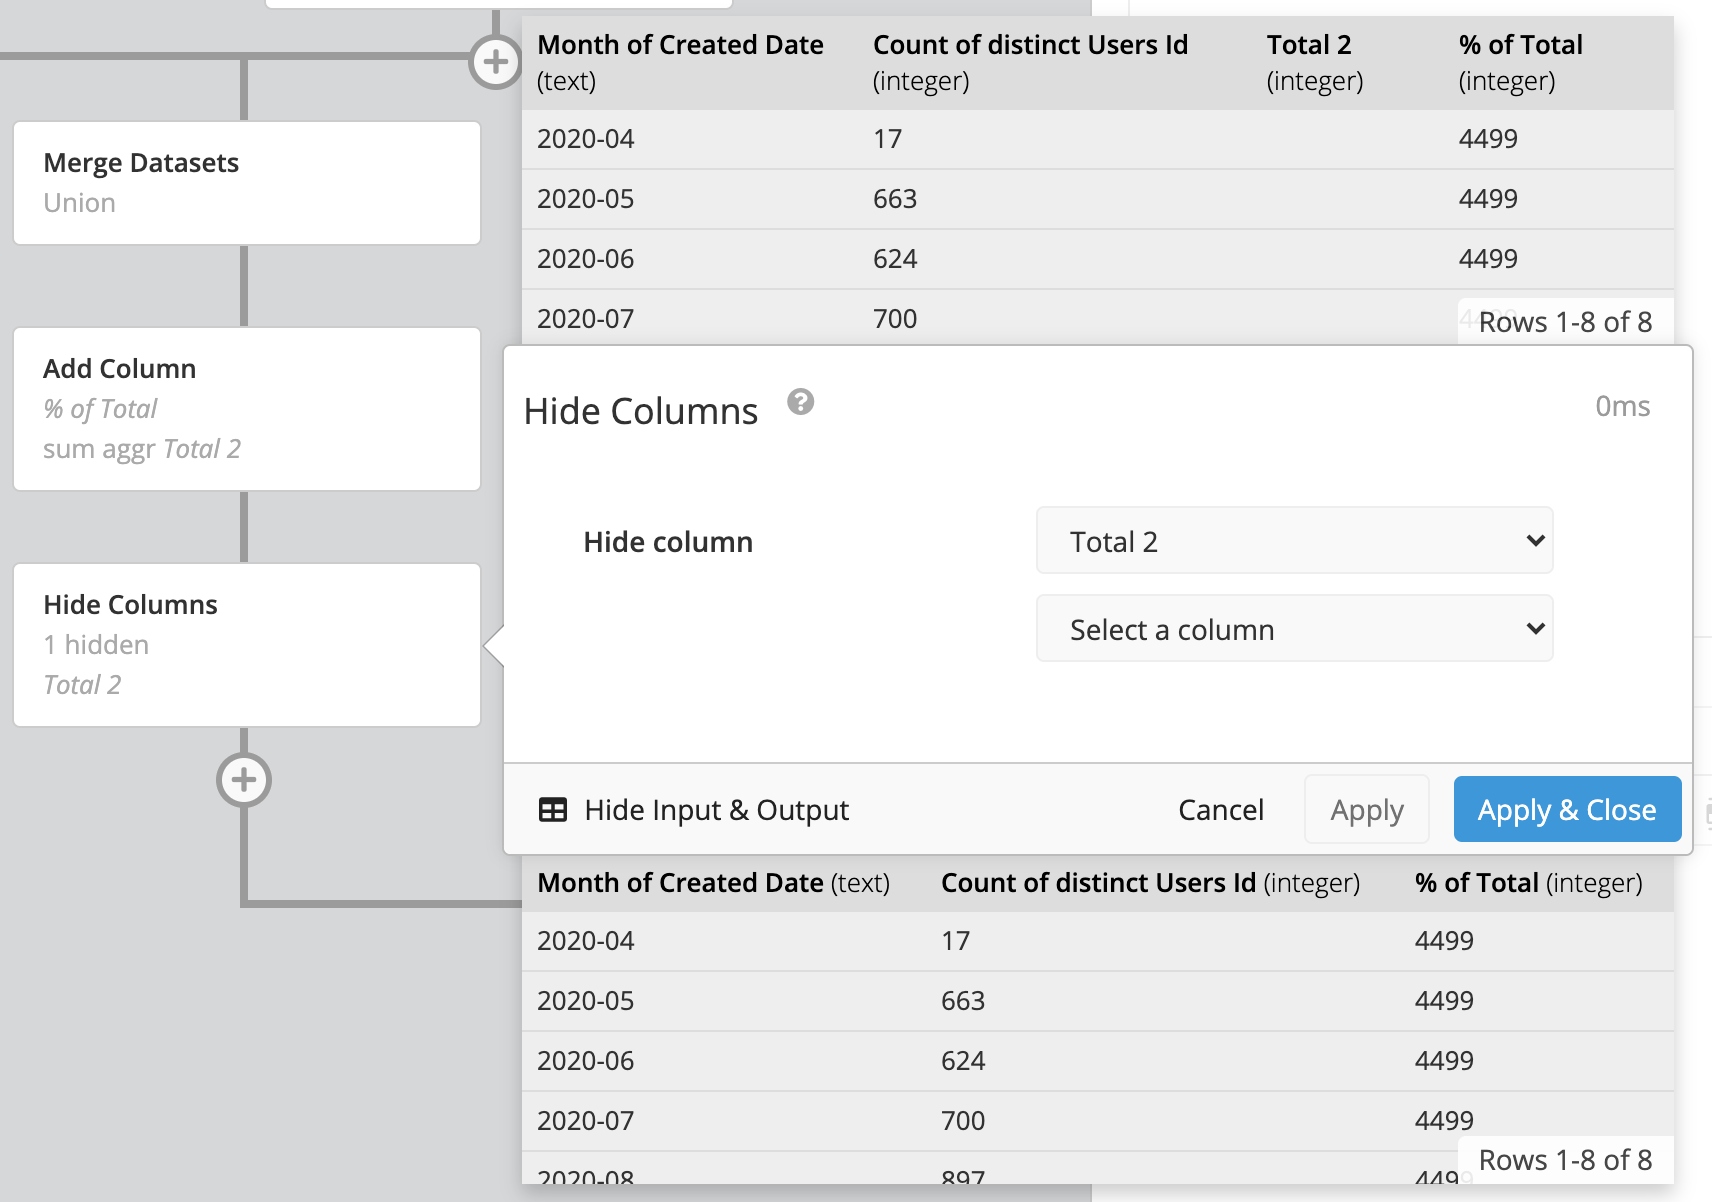
Since it’s no longer necessary, hide the column you created in Step 5.
-
Add an Edit Column step. Select % of Total for the Column, select Custom for the Formula Type, and use the following formula:
1.0 * "Count of distinct Users Id" / "% of Total"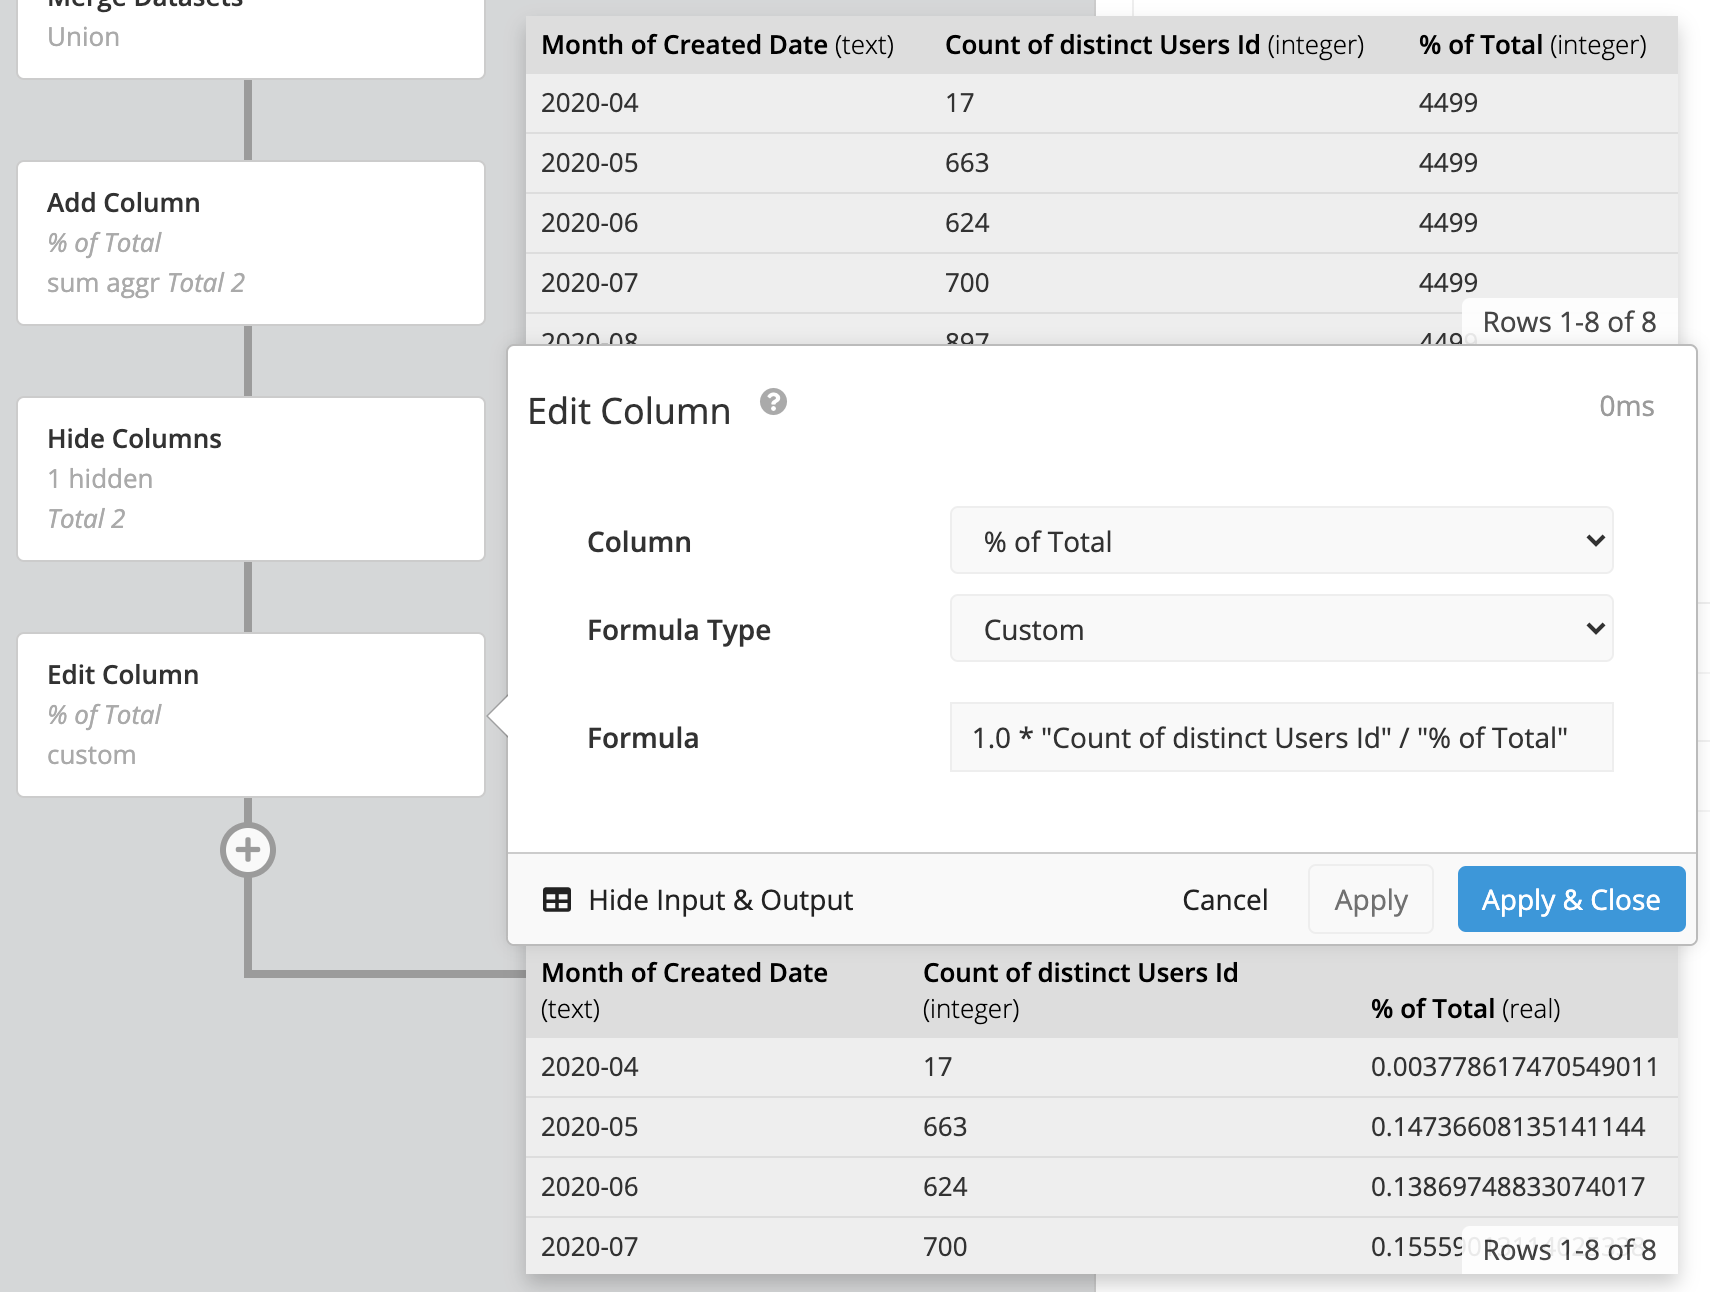
-
Click Settings above your chart to open the chart settings and go to the Columns tab. Click + Add New Formatting Rule. Select % of Total for the Format Column and Percentage for the Data Format.