Table Chart Settings
| General | Color | Columns |
| Conditions | Drilldown |
General
“Chart title” and “Title font size” values can be found in the General section of our Chart Settings page.
- Hide redundant values
- Hides duplicate values in the first column
- Zebra stripes
- Alternates the background color of the rows in the chart
- Font size
- Changes the font size of the chart; minimum value is 8
-
If your dashboards are displayed on monitors or are often printed, you may want to make the font larger within your Table charts to make them easier to read.
-

-
Note: Chartio dashboards are responsive, so charts will also change size depending on browser width.
- Show row aggregation for numeric columns
- Aggregates the values of each numeric column and shows the outputs in an aggregation row at the bottom of the chart by default
-
The default aggregation type is SUM.
-
Note: You can change the aggregation type for a specific column (e.g., average instead of sum) by adding a new formatting rule in the Columns tab.
-
Tip! If you want some of the aggregation rows to be treated as text and exclude them from the aggregation row, you can simply cast them as text in the Pipeline. Check out our FAQ for how to change a data type in the Pipeline.
- Show aggregation row at the top
- Available when Show row aggregation for numeric columns is selected
-
Makes the aggregation row the first row of the chart
-
The totals row always displays at the bottom or top of the chart (depending on your selection), even if all the rows don’t fit in the available chart space.
- Word wrap automatically
- If selected, wraps the cell’s contents if a cell has contents longer than the cell width in the chart (e.g., a cell containing a long email message); otherwise, the contents may be truncated.
-
Check out our FAQ for more tips on how to handle long text in Table charts.
Color
“Background color” can be found in the Color section of our Chart Settings page.
Columns
Default Column Formatting
These settings are applied to all columns in the Table chart.
- Number formatting
- Select the number format and how to handle rounding
- Number format options:
- 1,000.00
- 1000.00
- 1 000,00
- 1000,00
- Rounding options:
- No rounding
- Round to integers
- 2 decimal places
- Number format options:
- Date formatting
- Select one of the following date formats:
- Default (e.g., Apr 1, 2020)
- ISO-8601 (e.g., 2020-04-01)
- Text
- Choose the text color, styling (bold, italics), and alignment of the column
Add New Formatting Rule
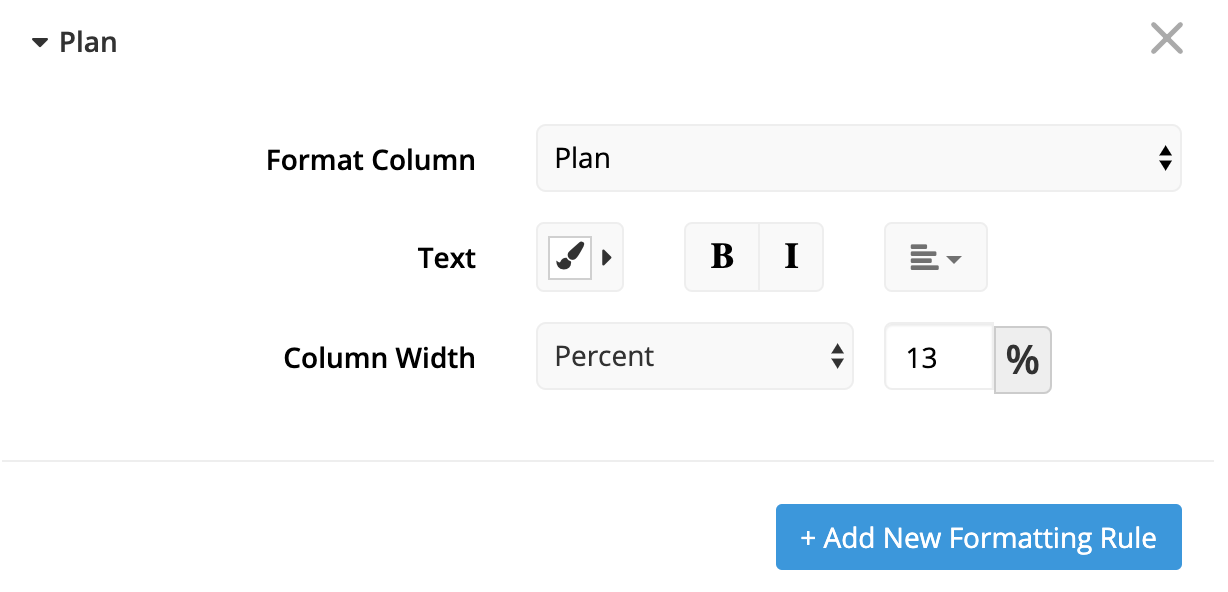
Click Add New Formatting Rule to create a new formatting rule for a specific column.
- Format column
- Choose the column from your Table to which you’d like to add a new formatting rule
- Text
- Available after choosing a column for Format column
-
Choose the text color, styling (bold, italics), and alignment of the column
- Column width
- Available after choosing a column for Format column
-
Width of the column
- Auto: Dynamic column width dependent on the row length
- Percent: Specify a fixed percentage of the Table for the column width. Other columns’ sizes will auto-adjust accordingly. Any text-overflow in your column will be truncated with an ellipsis, and the full text is viewable on hover or by clicking the “View all columns and rows” link at the bottom of the Table
-
Adjusting the column width is one way to make more space for a column containing long text.
-
Tip! If you need a column in your chart for formatting or other reason but you don’t want it displayed in the table on your dashboard, you can “hide” the column by setting its width percentage to 0. Note that the column’s results will still be available in the extended table view and in Table downloads.
-

- Datetime formatting
- Available if the column chosen for Format column is a datetime
-
If you use the Quarter time bucket, the format is always YYYY QQ (e.g., 2020 Q2).
| Second formatting | |
|---|---|
| Format Option | Example |
| Default | Apr 1, 2020 16:59:59 |
| ISO-8601 | 2020-04-01 16:59:59 |
| Twelve hour clock | Apr 1, 2020 4:59:59 PM |
| Minute formatting | |
|---|---|
| Format Option | Example |
| Default | Apr 1, 2020 16:59 |
| ISO-8601 | 2020-04-01 16:59 |
| Twelve hour clock | Apr 1, 2020 4:59 PM |
| Hour formatting | |
|---|---|
| Format Option | Example |
| Default | Apr 1, 2020 16:00 |
| ISO-8601 | 2020-04-01 16:00H |
| Twelve hour clock | Apr 1, 2020 4:00 PM |
| Day formatting | |
|---|---|
| Format Option | Example |
| Default | Apr 1, 2020 |
| ISO-8601 | 2020-04-01 |
| Long | 1 April 2020 |
| Week formatting | |
|---|---|
| Format Option | Example |
| ISO-8601 | 2020-W14 |
| Long(start day - end day) | Mar 30 - Apr 05, 2020 |
| Month formatting | |
|---|---|
| Format Option | Example |
| Default | Apr 2020 |
| ISO-8601 | 2020-04 |
| Year formatting | |
|---|---|
| Format Option | Example |
| Default | 2020 |
| ISO-8601 | 2020 |
The following fields are available if the column chosen for Format column is a number:
- Data format
- Select one of the following formats:
- Number
- Currency
- Percentage
- Number formatting
- Select the number format and how to handle rounding
- Number format options:
- 1,000.00
- 1000.00
- 1 000,00
- 1000,00
- Rounding options:
- No rounding
- Round to integers
- 2 decimal places
- Number format options:
- Aggregate row
- Specify the aggregation type to use when Show aggregation row for numeric columns is selected from the General tab
-
Options:
- Sum
- Average
- Column ratio
- Maximum
- Minimum
- None
Conditions
Apply formatting to column values when they meet a specific condition. You may apply as many conditional rules to a chart as you wish.
Note: Later rules can override earlier rules. If a column value fits multiple rules, the later rule will be applied.
The following settings fields appear after clicking Add New Conditional Rule:
- Format column
- Select the column to create a conditional rule for, or choose to create a conditional rule for all columns of the same data type:
- All text columns
- All numeric columns
- Select condition
- Specify the condition to check for; options vary based on the column’s data type
- For any data type:
- Is null
- Is not null
- String-specific condition options:
- Text contains
- Text does not contain
- Text starts with
- Text ends with
- Text is exactly
- Number-specific condition options:
- Is greater than
- Is greater than or equal
- Is less than
- Is less than or equal
- Is equal
- Is not equal
- Is between
- Is not between
- Datetime-specific condition options:
- Date is
- Date before
- Date after
- For any data type:
- Text style
- Choose the text color and styling (bold, italics) to apply to the column(s) when the condition from Select condition is met
- Background color
- Choose the cell color to apply to the column(s) when the condition from Select condition is met
- Apply formatting to row
- Applies the Text style and Background color to the whole row, rather than just the specific column(s)
Examples
Check out our step-by-step video showing an example of setting up conditional formatting:
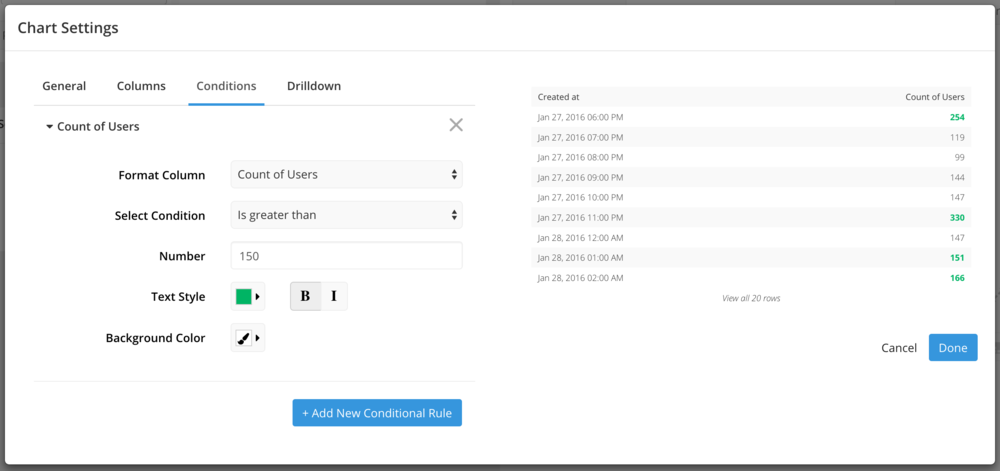
In this next example below, we want to highlight any results where the count of new users is greater than 150. To do this, we select our Count of Users column, set our condition to “Is greater than 150”, and adjust our Text Style options and Background Color as needed. Then, click Done to save the changes.

Drilldown
Check out Drilldowns for more information on this tab.