Long text in a Table chart
You may often find that you have long titles or labels in your data—and you want to preserve those values and not reformat them to fit in a small space in your Table chart. You have a few options for handling such long text in your Table charts.
Option 1 - Word wrap
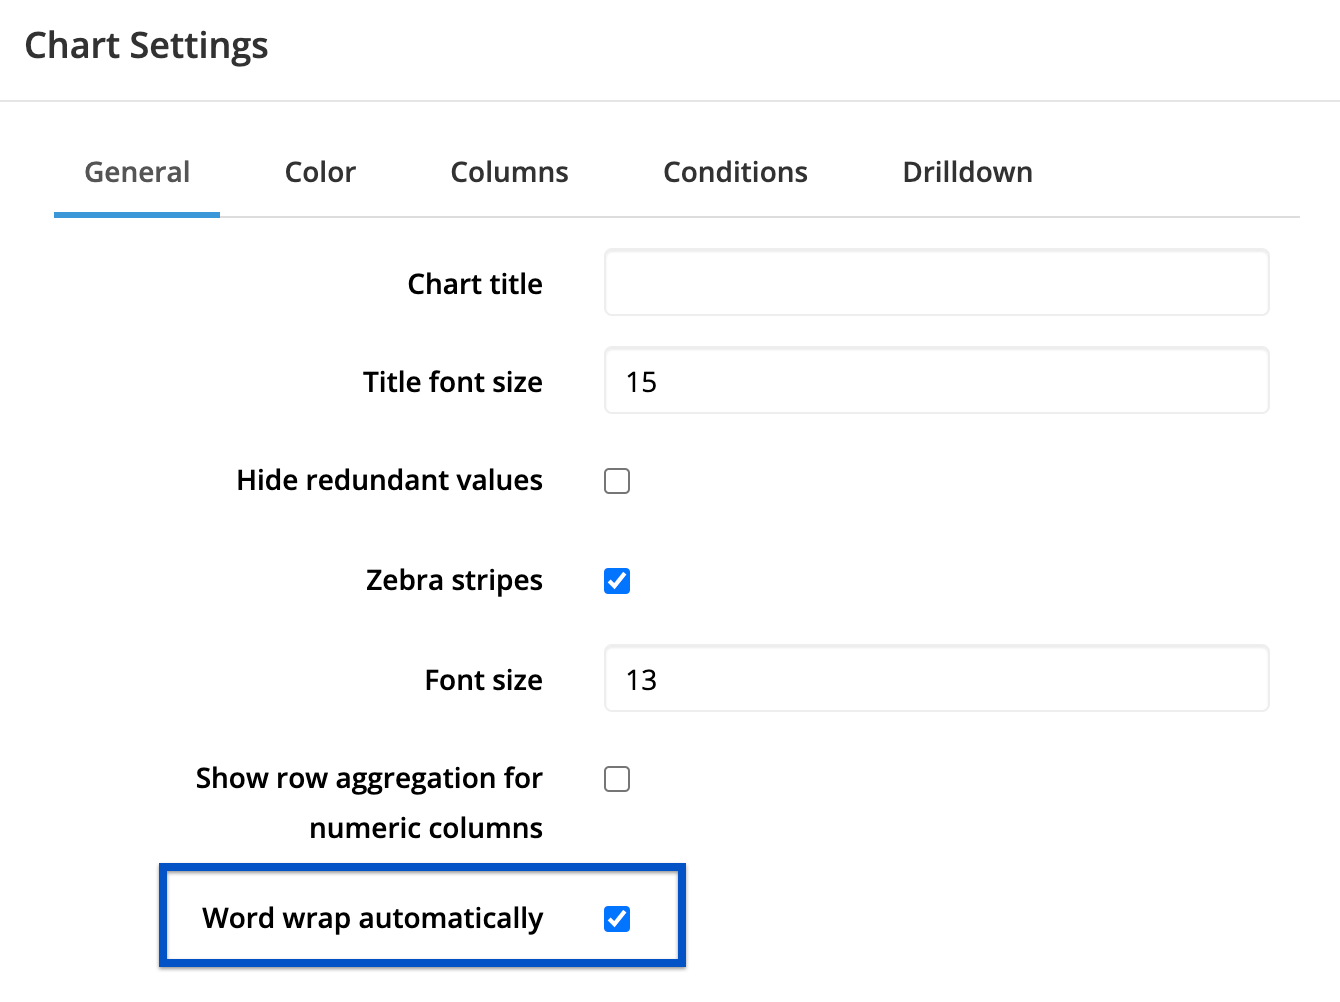
You can enable word wrap on your Table chart through the chart settings as shown below. Depending on the various lengths of the text in your columns, this may result in a bit of an inconsistent presentation of your data as some labels will span multiple rows, while others may only use one row.
Option 2 - Adjust column width
A second option is to adjust the column width for Table charts by navigating to the Columns tab under chart settings. You may add a new rule to a column and adjust its width.
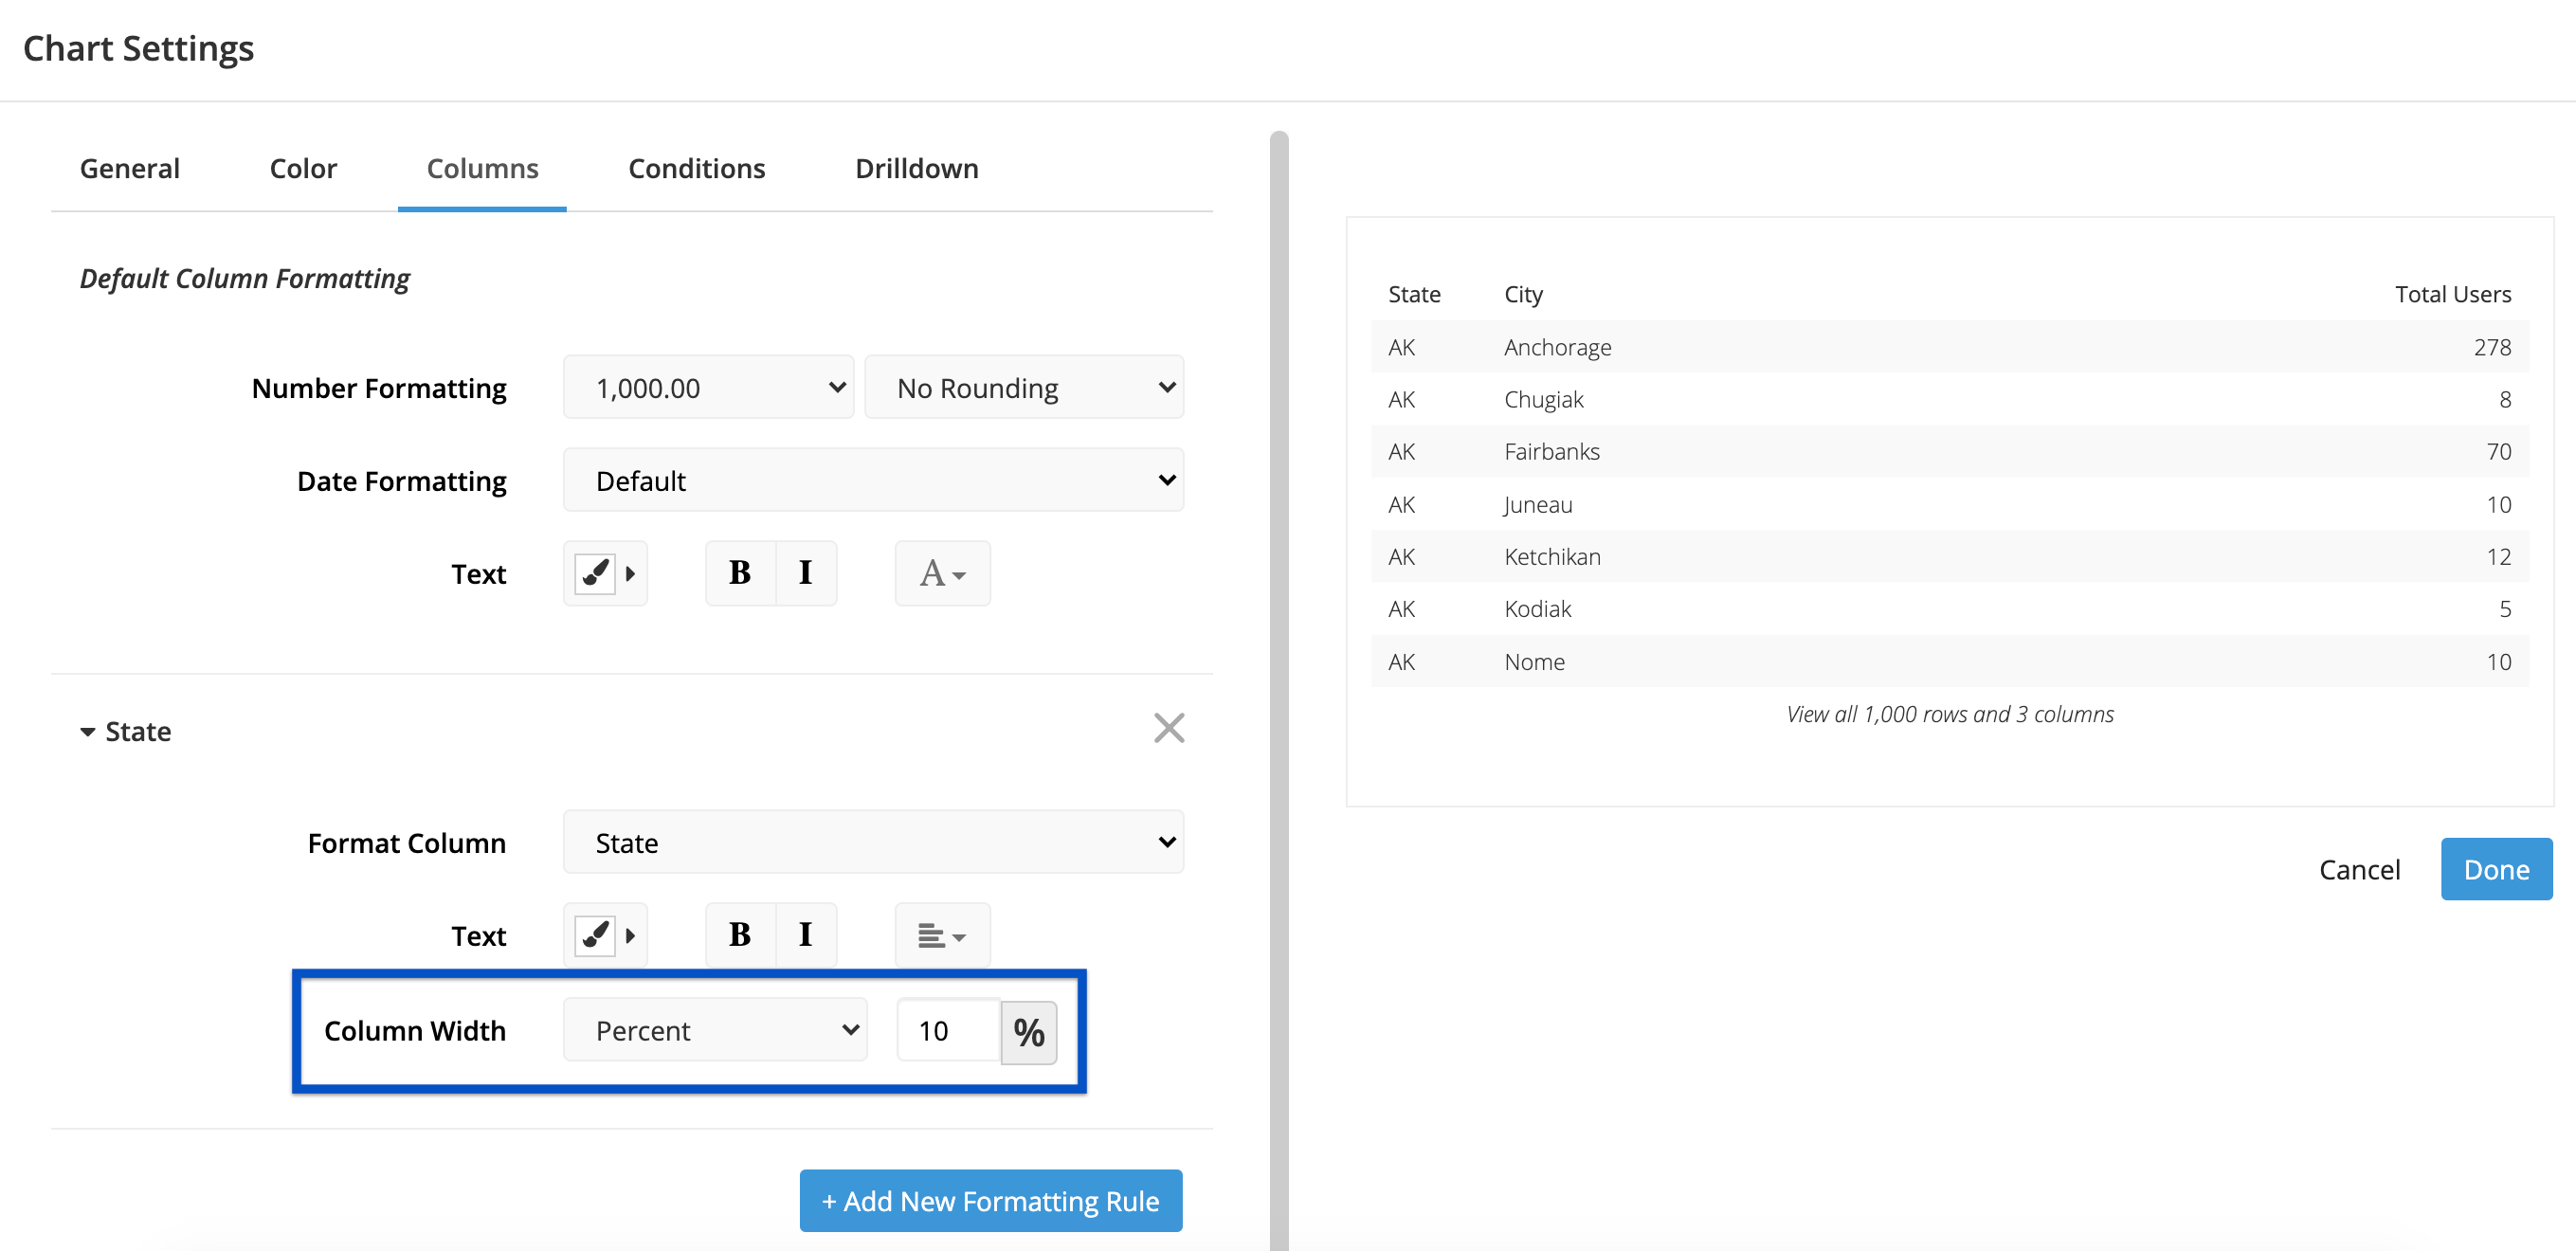
One thing to note when you adjusting the column width is that Chartio only displays the first 100% of your Table. If the total sum of all the column percentages exceeds 100, all your columns may not display on your chart. To fix this problem, you need to toggle through each of your custom column formatting rules and adjust the percentages to ensure the total does not exceed 100%.
Option 3 - Use Drilldowns
One last option for handling long text is to enable clicking the text column to display the full text using Drilldowns by following the steps outlined below.
In this example, we have a Table chart with a truncated text column. We want to be able to click the text column to display the full text.
-
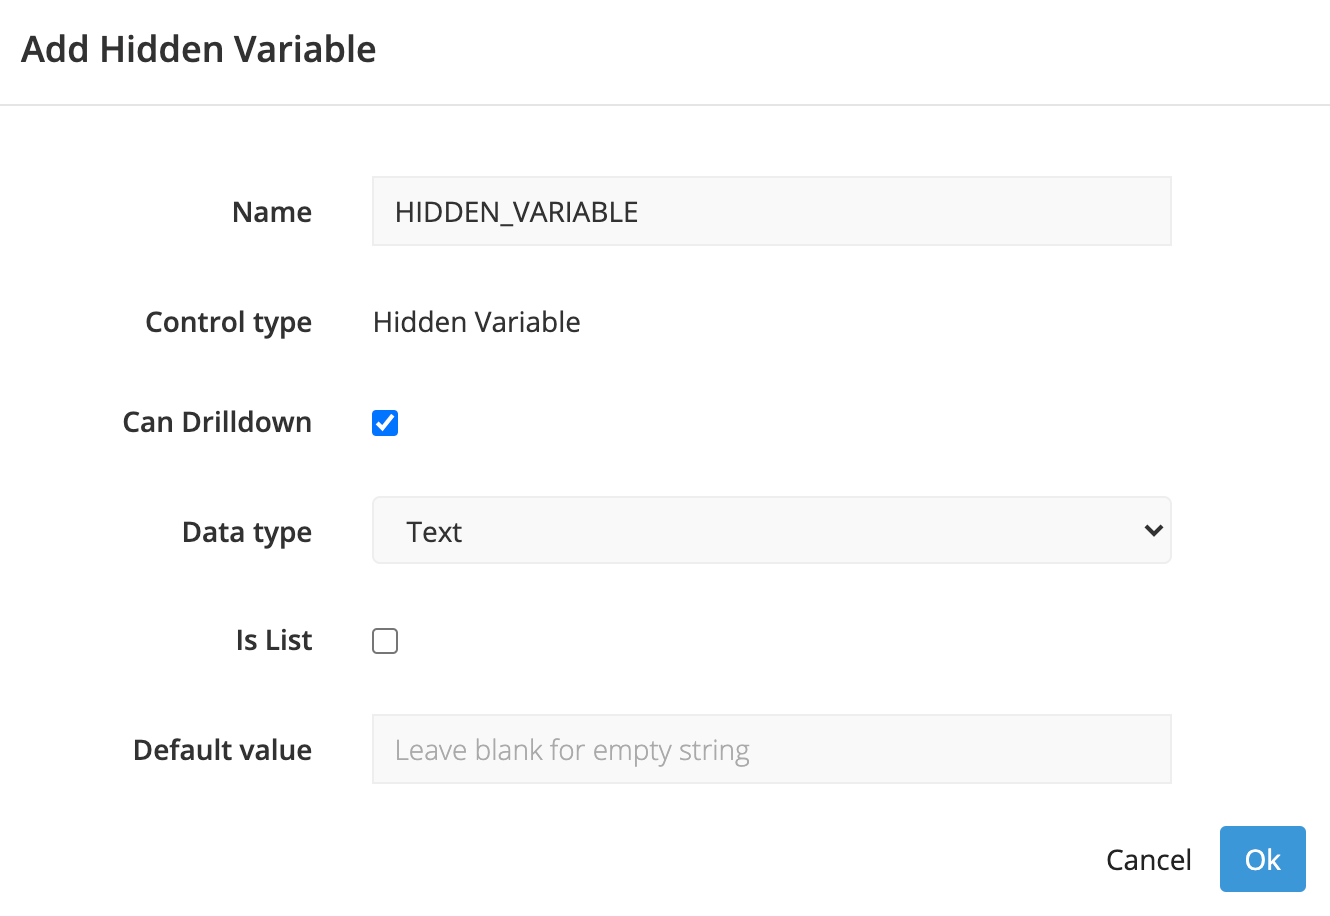
Add a new Hidden Variable to your dashboard. Be sure to select Can Drilldown from the Control’s settings.
-
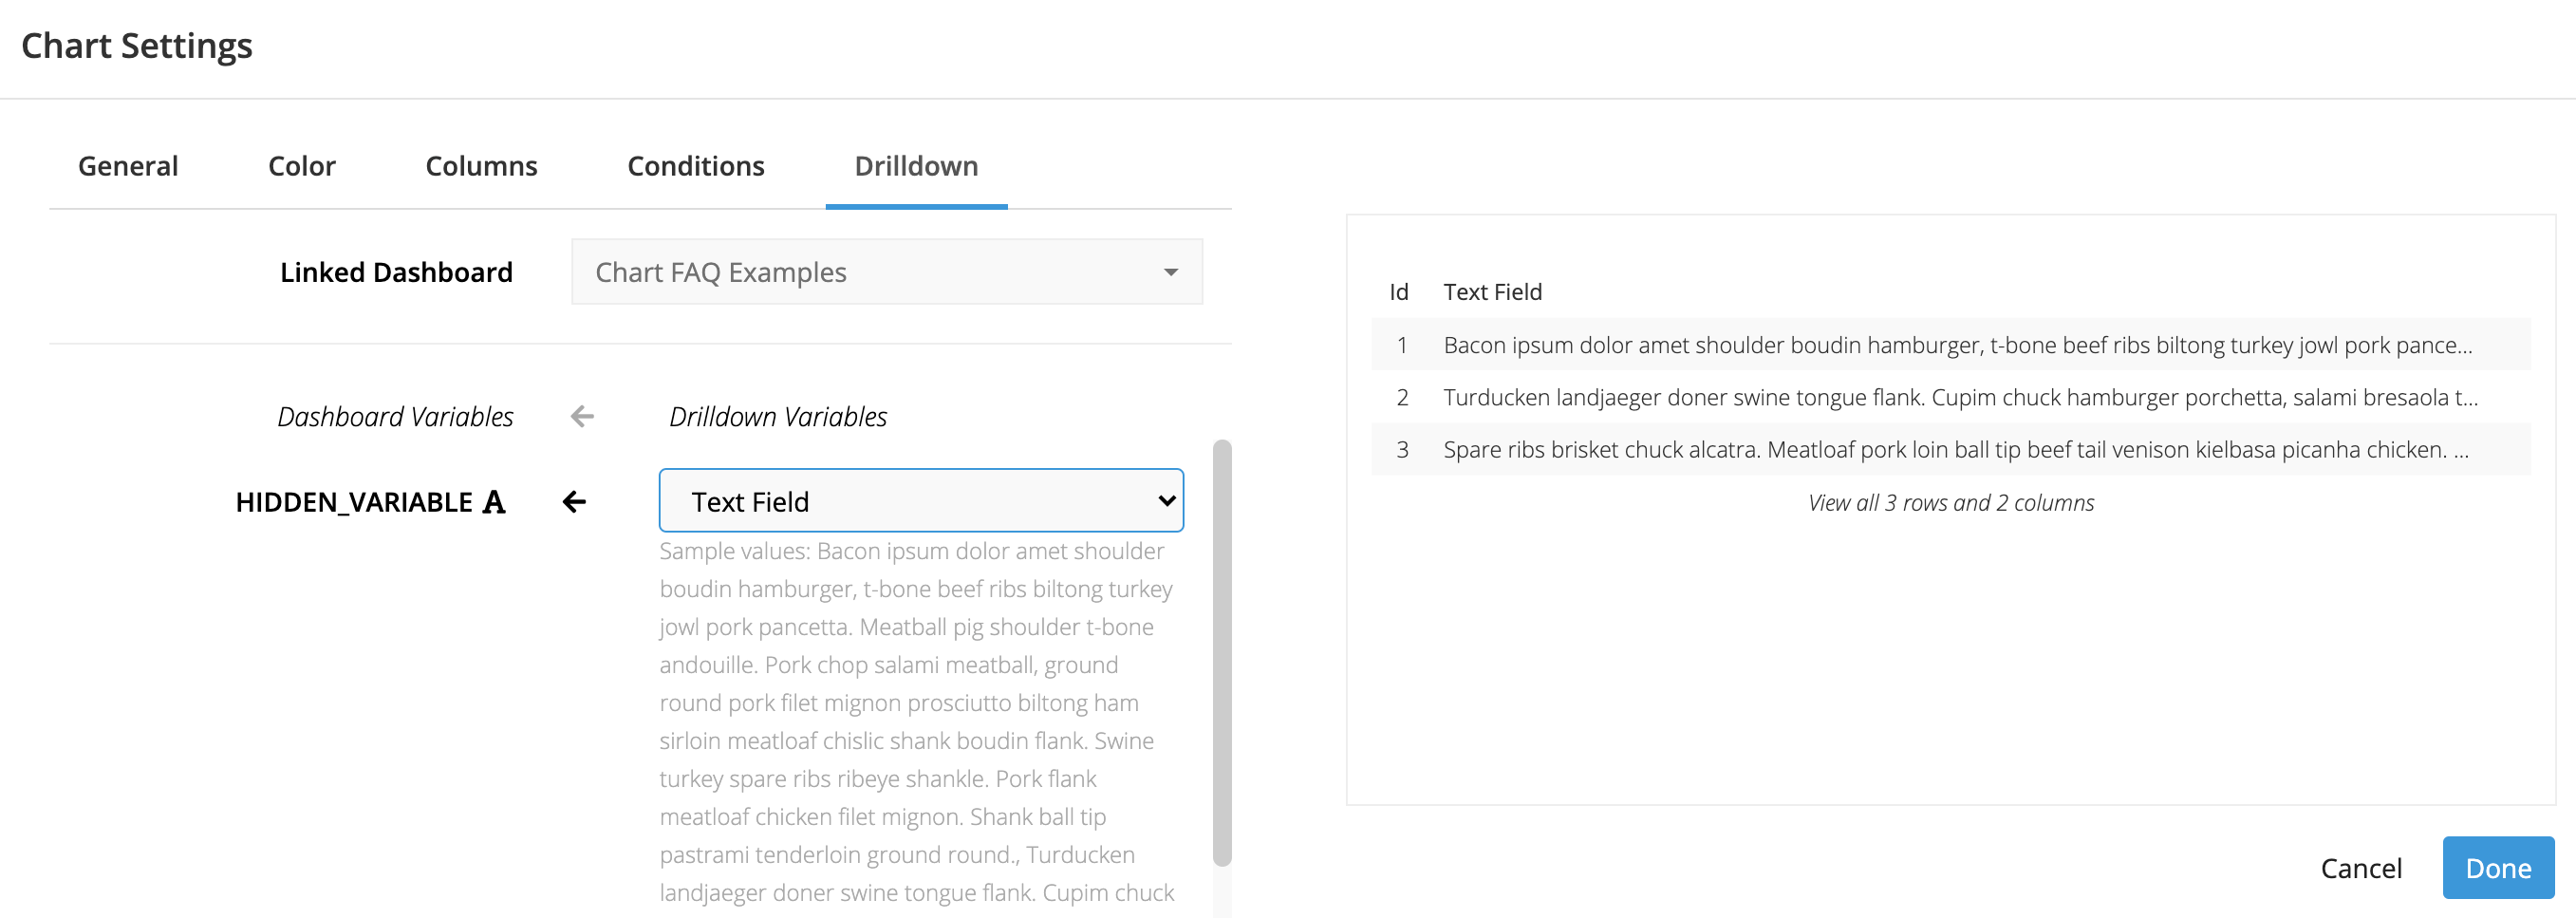
Open the Chart Settings for your Table chart, and switch to the Drilldown tab. Select the current dashboard, and map your text column to the new Hidden Variable.
-
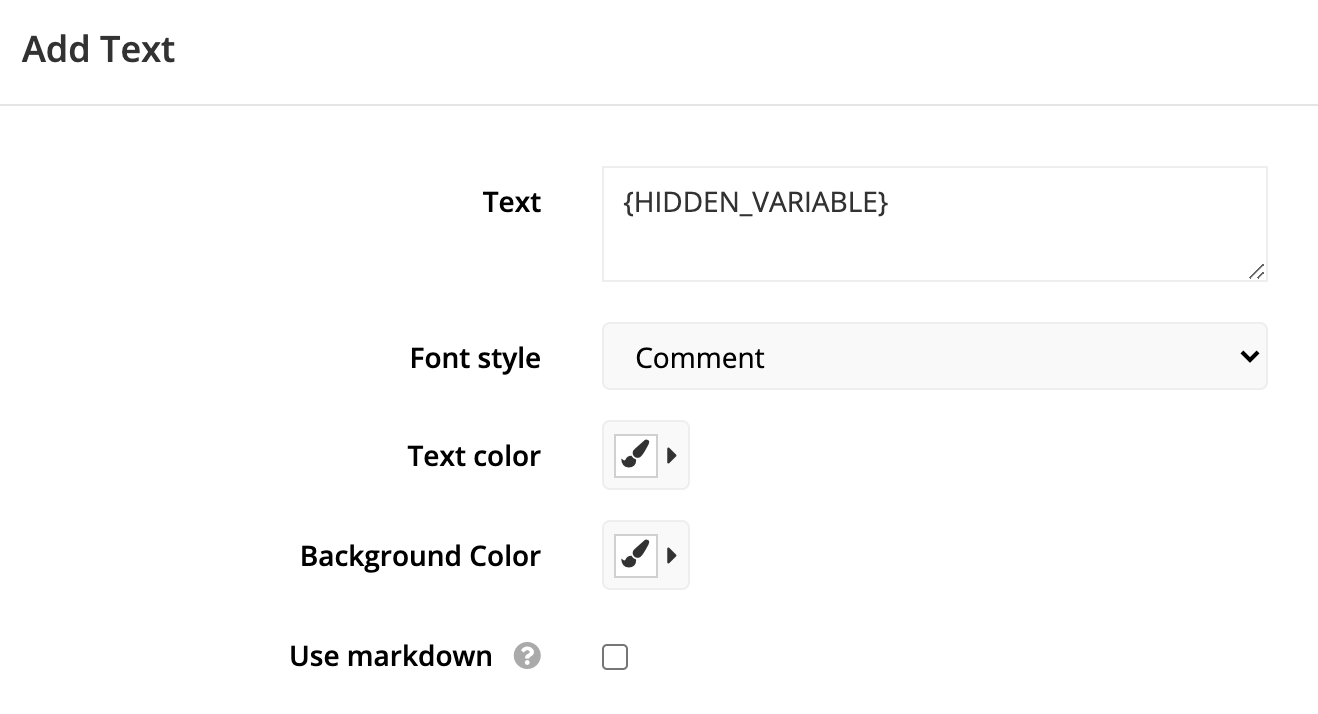
Add a Text element to your dashboard by clicking Add Text from the dashboard sidebar menu. In the Text box, enter the name of your Hidden Variable wrapped in curly braces. Select your preferred font style then click Done.
You can now click a row in your Table, and the Text element will populate with the content of the Text Field.
Note: You may need to refresh your browser after the creation of the Text element in order for the changes to take effect.