Track marketing metrics using a Funnel chart
Because there’s no single number that will give you insight into how your marketing efforts are performing, make a marketing KPI (Key Performance Indicator) dashboard comprised of a few different metrics to give you insight into your performance, find gaps in your process, and identify lucrative activities.

Each company and industry has slightly different KPIs, but it should always be based around the crucial number your team needs to hit each quarter. In order to determine what they should be, ask yourself:
- What are my organization’s main objectives?
- How do my marketing efforts contribute to those objectives?
- Is there a meaningful metric that measures my efforts against the objectives?
- Do I have the data I need to effectively measure those metrics?
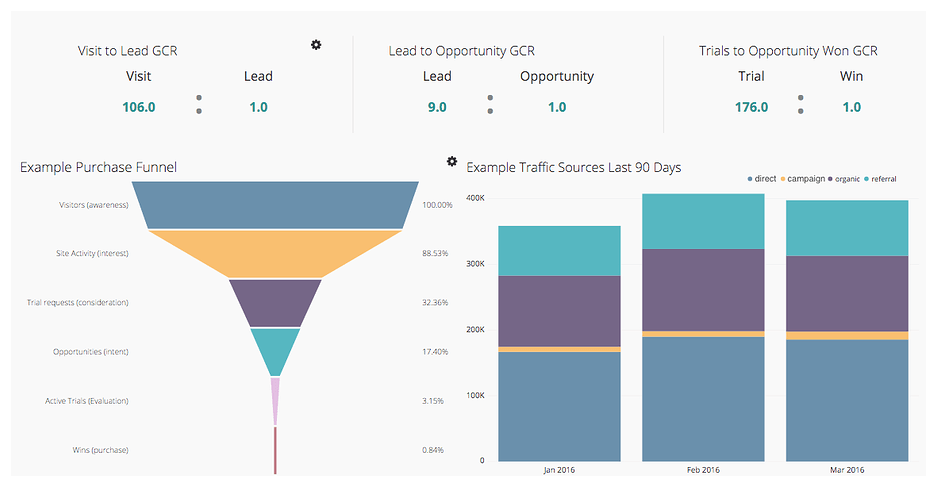
In this example, the main areas we’ll look at are purchase funnel, goal completion rate, and traffic sources.
Purchase funnel
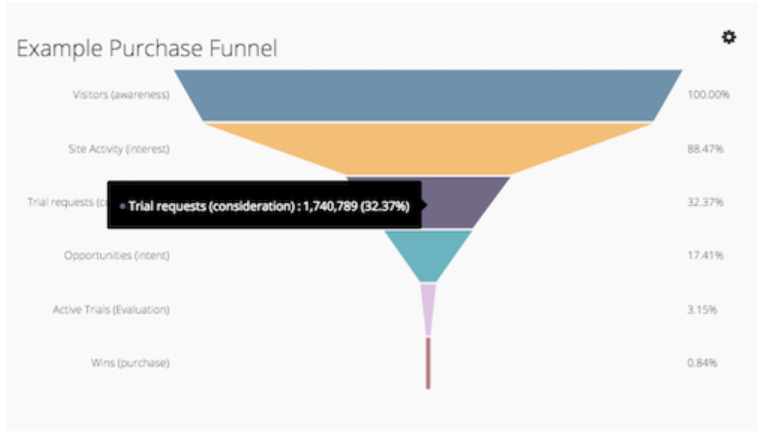
The purchase funnel, AKA sales funnel, outlines the journey towards the purchase of your product or service and allows you to analyze your weak points in the funnel. It gives you insight into how a prospect goes from the discovery of your product or brand to the sale and where they drop off in the process. This funnel is usually broken down into six stages:
- Awareness
- Interest
- Consideration
- Intent
- Evaluation
- Purchase (This stage can include data from all your marketing and sales initiatives, such as interaction on social media, paid search campaigns, outbound emails, and nurture emails)

Goal completion rate
If you have goals within each stage of the purchase funnel, such as a driving factor to the end goal (e.g., subscribing to a mailing list, signing up for a trial, or downloading a white paper), finding the metrics of these goals will help you better understand your entire purchase funnel and how your prospects pass through each stage of the funnel. These metrics are a starting point to perform deeper analysis on what’s happening within the funnel, allowing you to optimize each stage.

Source tracking
A helpful way to get an understanding of where your visitors are coming from is to create a chart of your traffic sources. You can do this from your site data using a data source such as Google Analytics. The main traffic sources to track are direct traffic (typing your URL directly into the browser), traffic coming from your different campaigns (paid, email, social, etc.), organic traffic (finding you through a search engine), and referral traffic (arriving on your site via another website).
Drill down into each source to discover insights into the success of each campaign, referral program, and keywords that drive quality visitors.
![]()