Build a dynamic Bar chart to compare time periods
It can be helpful to create a chart that monitors a metric’s growth in comparison to something else. Rather than using static date values, you can leverage Chartio’s Relative Date Variables to create dynamic charts whose date ranges update automatically. This is an example of a Bar chart that compares visitors in the current month with the previous month:

Here’s how you can do it:
In the Visual SQL interface
-
Create a new chart by clicking Chart from the top nav bar.
-
Select your data source at the top-left corner of the Query. In this example, we use our Dundersign Demo Data data source, which every Chartio user has by default.
If you don’t see Dundersign Demo Data in your data source dropdown but would like to use it, you can add it as a new data source by selecting Dundersign Demo Data at the bottom of the page.
-
From the Ticket table, add the Id and Created Date columns to the Columns section of the Query.
- Leave the aggregation as Count of distinct for Id and the time bucket as Day for Created Date.
- Click Ticket Id in the Result Table to rename the column; change the name to
Previous Monthfor clarity.
-
Now also add the Created Date column to the Filters section of the Query. We want to make sure to use the same date column for bucketing and filtering our metric.
- For the filter operator, use between and including
-
For the starting date of your filter range, use
{CURRENT_MONTH.START.SUB(1, 'month')}.This Relative Date Variable sets the current date of the filter to the first day of the previous month. To explain the code a bit more, it starts with the current month, goes to the first day of the current month, then subtracts one month—giving the first day of the previous month!
-
For the ending date of your filter range, use
{CURRENT_MONTH.END.SUB(1, 'month')}.This is similar to how we got the starting date, but instead looks at the last day of the month.

- Click Run Query.
Note: You can transform the output data of your query by adding a few steps in the Pipeline. For instance, you can add a Zero Fill step to the Pipeline. In our example, this shouldn’t change anything, but it’s good to have this step in case you have any gaps in your data.
-
Use Apply Formula to get a Running Total of the Previous Month column. Click Save. Your “Previous Month” column now reflects the previous month’s running total.
-
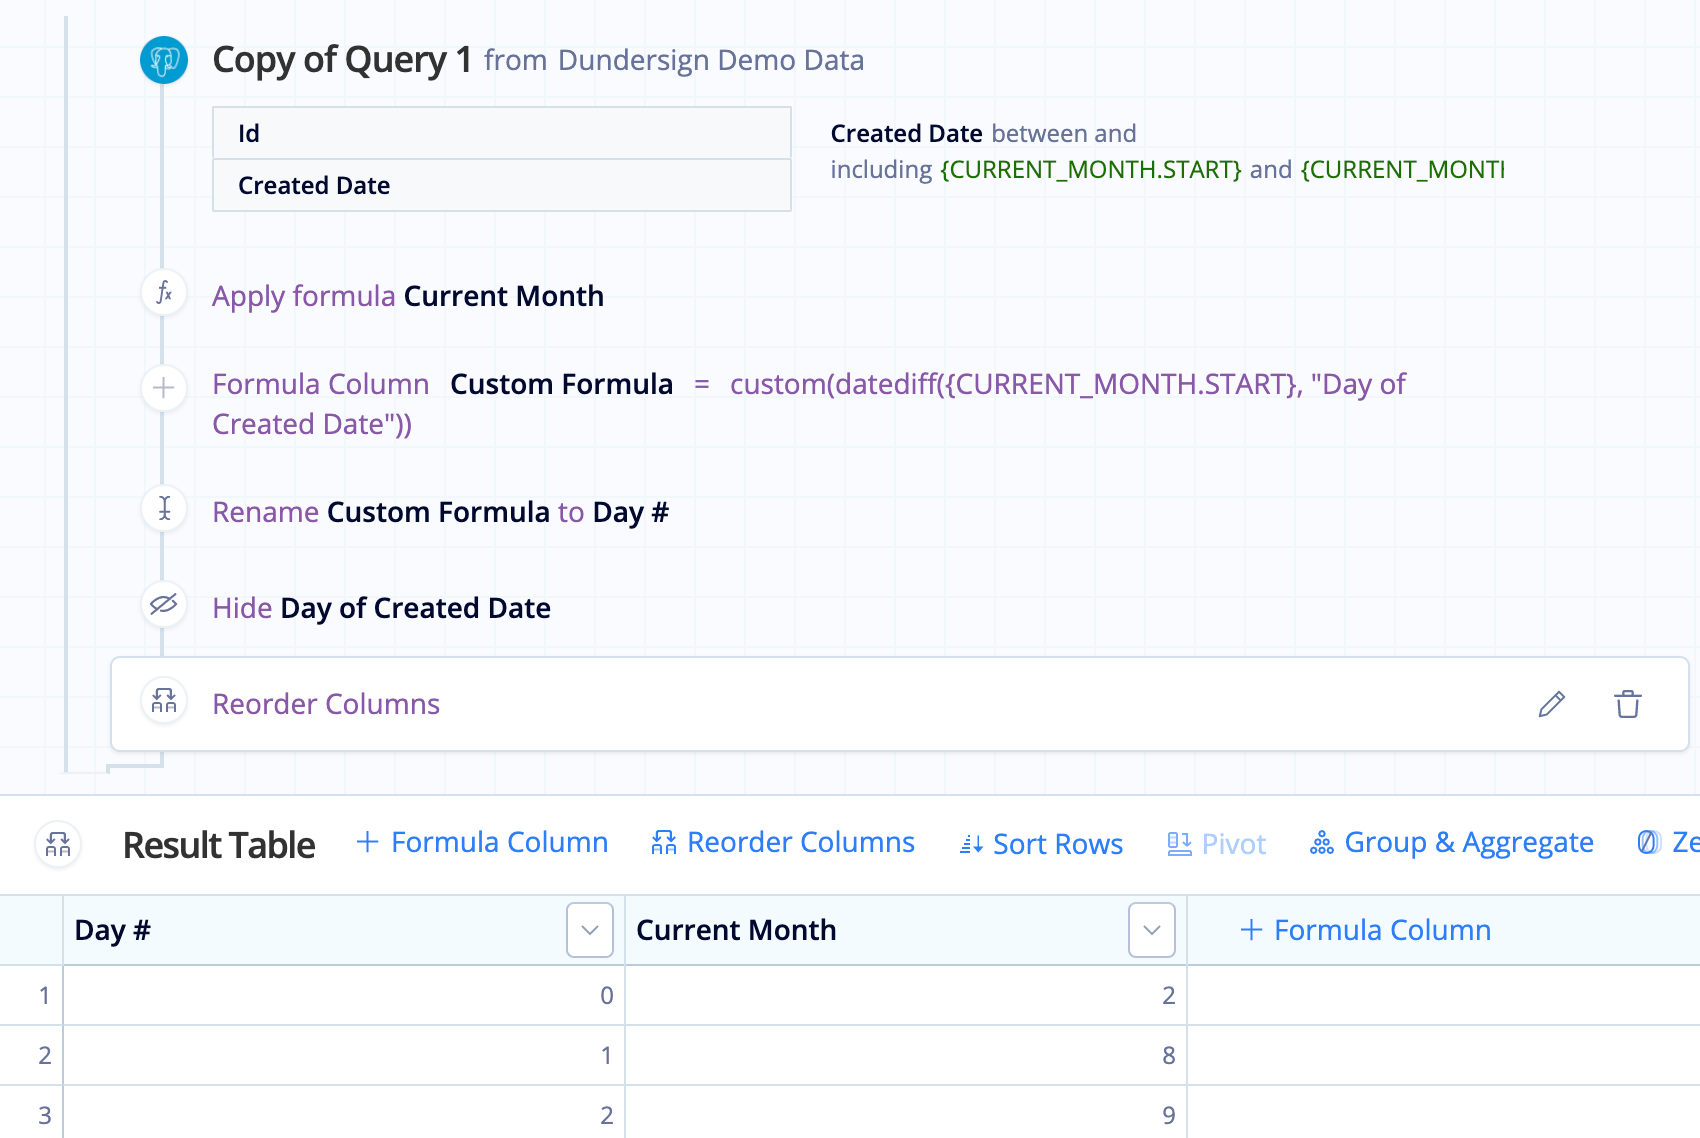
In order to compare the count on the first day of the previous month to the first day of the current month, we need to add another column. Add a Formula Column and select Custom formula. Then use the following formula to calculate the difference between the first day of the previous month and whatever date is in each row of the “Created Date” column:
datediff({CURRENT_MONTH.START.SUB(1,'month')}, "Day of Created Date")For clarity, let’s also rename this column to Day #.
-
Hide the Day of Created Date column. Since we’ll compare using the “Day #” column, we don’t need the “Day of Created Date” column anymore.
Tip! You can combine Steps 6 and 7 by instead using an Apply Formula Action on the “Day of Created Date” column and use the same Custom formula provided in Step 6. Then just rename “Day of Created Date” to “Day #”.
-
Use the Reorder Columns or Move to Start Action to move Day # to the far left of the Result Table.
-
Now you need to bring in data for the current month. Click Add Query > Copy of Query 1 to quickly make a clone of the first Query. You need to apply the same transformations (Steps 2 - 8) to the second Query (with a few adjustments) to properly merge the two queries, which we can do before we merge them:
-
For Copy of Query 1, edit the starting and ending dates for the Created Date filter to
{CURRENT_MONTH.START}and{CURRENT_MONTH.END}, respectively. - Click Run Query.
- Click Previous Month in the Result Table to rename the column; change the name to
Current Monthfor clarity. -
Click Run Query again.

- Use Apply Formula to get the running total for the “Current Month” column.
-
Add a Formula Column, select Custom formula, then use the following formula:
datediff({CURRENT_MONTH.START}, "Day of Created Date")Rename this new column to Day #.
- Hide the Day of Created Date column.
- Move the Day # to the far left of the Result Table.
-
-
Click the Join Action that’s been added to your Pipeline to view the post-merge result set. By default, the two result sets are merged with an Outer Join, which is what we want for this example.
-
Select the Bar chart type and update the Bar chart settings by clicking the Gear above the Chart Preview. Deselect Unstacked from the General tab to have separate bars for the previous and current month’s data. Feel free to change the other settings too!
In the Data Explorer interface
- Create a new chart by clicking Chart from the top nav bar.
-
Select your data source at the top-left corner of the Dataset. In this example, we use our Dundersign Demo Data data source, which every Chartio user can access.
If you don’t see the Dundersign Demo Data in your data source dropdown but would like to use it, you can add it as a new data source by selecting Dundersign Demo Data at the bottom of the page.

-
From the Ticket table, drag the Id column to the Measures field and the Created Date column to the Dimensions field.
-
Leave the aggregation as Count of distinct for Id and the time bucket as Day for Created Date.

-
Click the Id column in the Measures field and change the column label for Id to
Previous Monthfor clarity. Click Ok.
-
-
Now also add the Created Date column to the Filters field of the Query. We want to make sure to use the same date column for bucketing and filtering our metric.
- For the filter operator, use between and including
-
For the starting date of your filter range, use
{CURRENT_MONTH.START.SUB(1, 'month')}.This Relative Date Variable sets the current date of the filter to the first day of the previous month. To explain the code a bit more, it starts with the current month, goes to the first day of the current month, then subtracts one month—giving the first day of the previous month!
-
For the ending date of your filter range, use
{CURRENT_MONTH.END.SUB(1, 'month')}.This is similar to how we got the starting date, but instead looks at the last day of the month.
- Click Ok to save the filter changes.

Note: You can transform the output data of your query by adding a few steps in the Pipeline. For instance, you can add a Zero Fill step to the Pipeline. In our example, this shouldn’t change anything, but it’s good to have this step in case you have any gaps in your data.
- Click Run Query.
-
Click + Add Tranformation and add an Edit Column step to the Pipeline. For Column, select the Id column, which should now be named Previous Month. For Formula Type, select Running total. Click Apply & Close.
The numbers in the chart table now reflect a running total.

-
In order to compare the previous month’s data to the current month, add a third column that’ll be used for merging later on.
- Add an Add Column step.
- Give this new column the name
Day #. - Select Custom Formula as the Formula Type.
- Use the following formula:
datediff({CURRENT_MONTH.START.SUB(1,'month')}. This calculates the difference between the first day of the previous month and whatever date is in each row of the “Day of Created Date” column. - Click Apply & Close.

-
Add a Hide Columns step to hide the “Day of Created Date” column then click Apply & Close. Since we’ll compare our data using the “Day #” column, we won’t need “Day of Created Date” anymore.

-
Use a Reorder Columns step to make the “Day #” column the leftmost column in your result set.

-
Now you need to bring in data for the current month. Click the arrow to the left of Dataset 1 and select Clone. This will create a copy of Dataset 1 and all Pipeline steps applied to it. Very convenient!

-
Edit Dataset 1 Clone so it brings in the current month’s data.
- Click Previous Month in the Measures field and rename it to
Current Month. Click Ok. - Click the Created Date column in the Filters field and remove
.SUB(1, 'month')from both the start and end dates. The start and end dates should now be{CURRENT_MONTH.START}andCURRENT_MONTH.END, respectively. Click Ok.

- Click Previous Month in the Measures field and rename it to
-
Click Run Query. You’ll initially get an error, so do the following to fix it:
- Click the Edit Column step in the clone’s Pipeline and change the column to Current Month. Click Apply & Close.
- Click the Add Column step in the clone’s Pipeline and remove
.SUB(1, 'month')from the Formula. It should now bedatediff({CURRENT_MONTH.START}, "Day of Created Date"). Click Apply & Close.
-
Select the Bar chart type and update the Bar chart settings by clicking Settings above the chart. Deselect Unstacked from the General tab to have separate bars for the previous and current month’s data. Feel free to change the other settings too!