X-axis date labels
If Chartio isn’t recognizing your dates as a time series, it won’t know that it can group the date values to display the series better.
Read on if your x-axis looks like this:

When it should look like this:

This could be happening for a few different reasons. Here are the most common solutions:
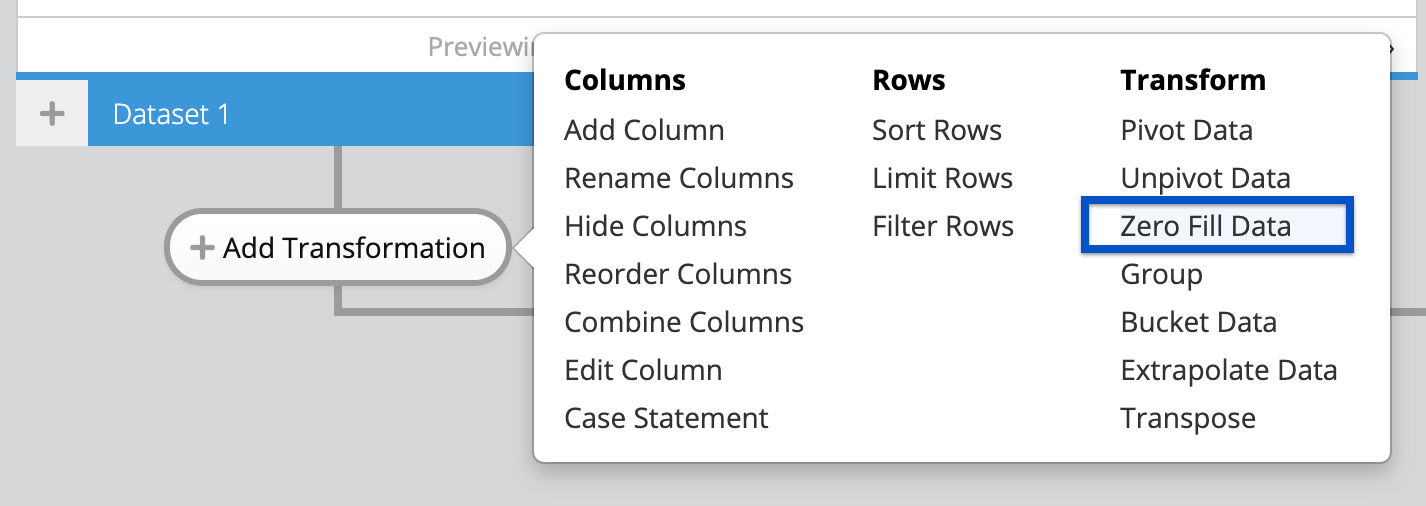
1) Try zero-filling the data
This is the most common fix. If there are dates missing from your date series, using Zero Fill will fill in the missing dates so Chartio can recognize the dates as a series.
| In the Visual SQL interface |
|---|
 |
| In the Data Explorer interface |
|---|
 |
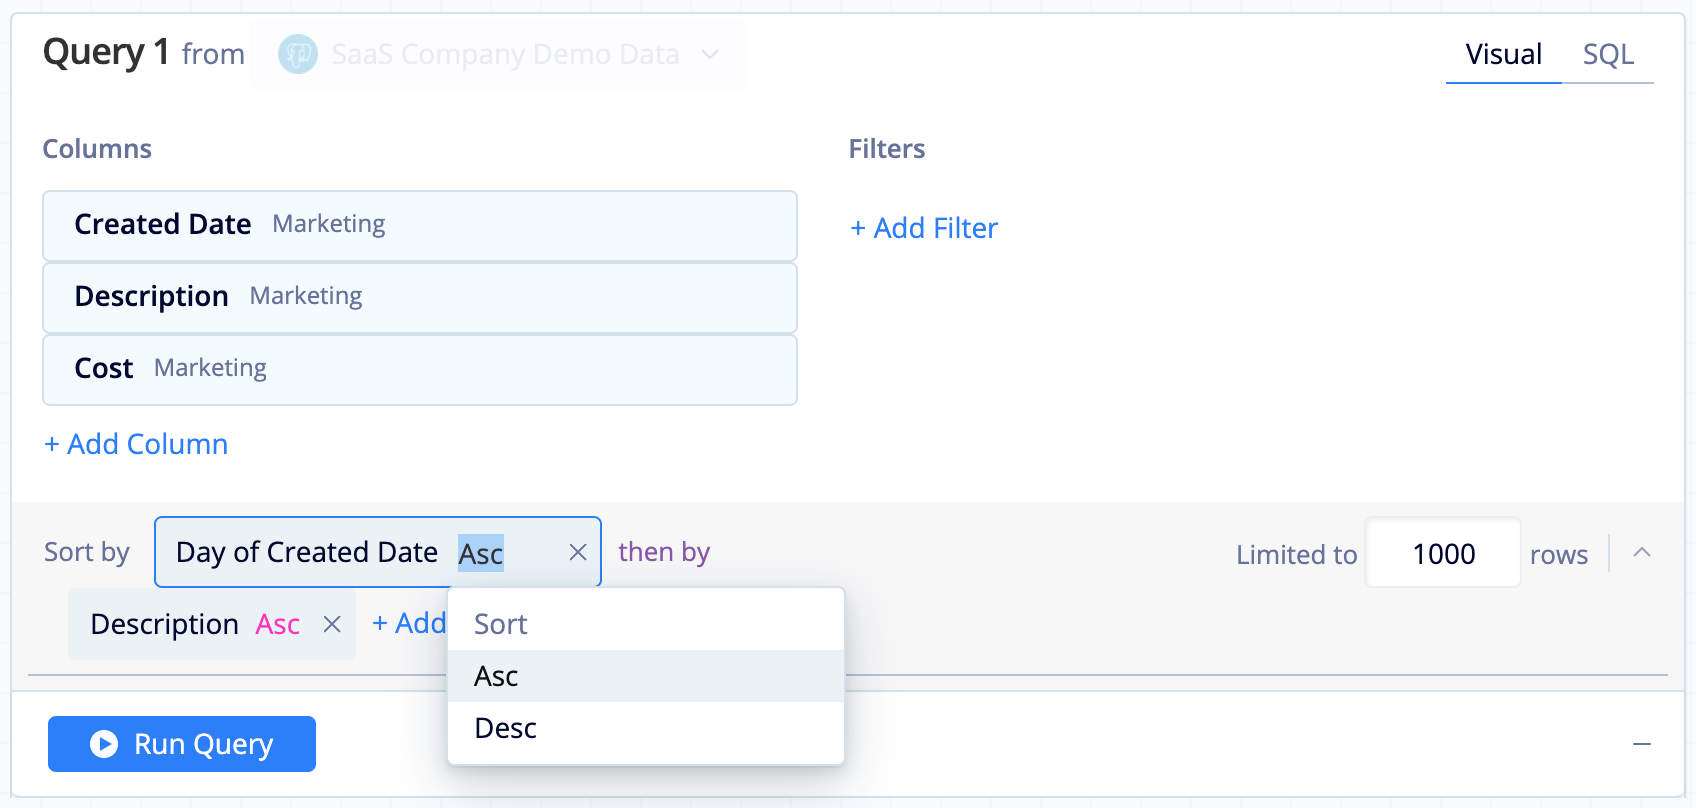
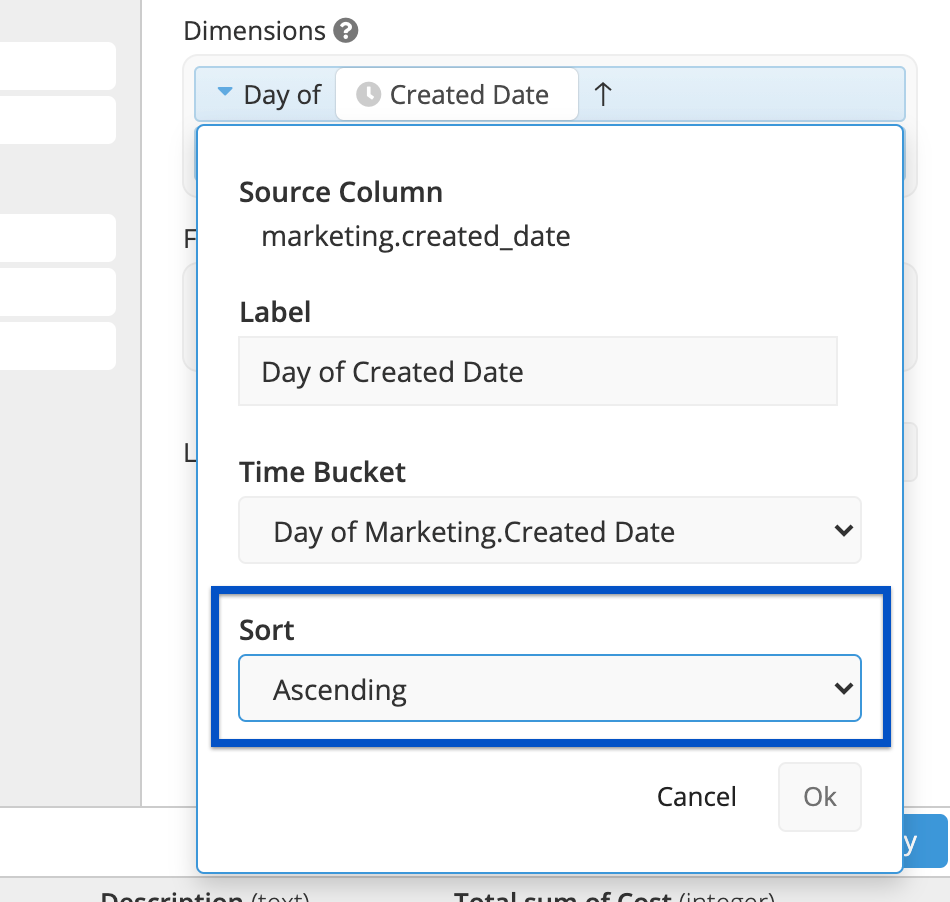
2) Sort your dates
If your dates are out of order, Chartio can’t group them as a series. Try sorting your dates. Click the date column name to open its settings pop-up, and select Ascending from the Sort dropdown.
| In the Visual SQL interface |
|---|
 |
| In the Data Explorer interface |
|---|
 |
3) Look for discrepancies in your data.
It’s possible there is a null value in your dates, or your dates are not formatted correctly. View the raw data being returned to look for any discrepancies. If applicable, filter out for null dates or format your dates in SQL Mode according to your database’s syntax.
To view your raw data, open the chart ellipsis menu and select View Chart Data. This will open up a table view of your chart’s data on the dashboard. Alternatively, click on Edit Chart Data from the dashboard and switch your chart to a Table temporarily to view all of your data.
4) Verify date format in SQL Mode
To recognize dates as dates, Chartio requires that they are formatted in a certain way. If you’re using SQL Mode, ensure your charts are using the correct date format. For more information, please see our documentation on date formatting options in charts.

5) Fill in the gaps with an outer join
Sometimes, the Zero Fill solution doesn’t always work. Another option is to add another Query where you only pull in a single column whose values are the continuous date range you’re trying to look at. To achieve this, we recommend checking out our FAQ for generating a time series. Then, use an Outer Join to merge this new Query with your original result set (make sure the date column is the leftmost column in your original result set). This essentially forces a continuous date range by adding in any missing dates to your original result set.